


GOLD PRICE OUTLOOK: PRECIOUS METAL PULLBACK EYES NEXT LEG HIGHER
- Gold gained 1.5% this past week on net after finding support around the $1,910-price level
- Gold price action looks on the cusp of a breakout from its recent consolidation pattern
- Precious metals like gold and silver could snap higher following the shakeout of weak hands
Gold prices have fluctuated aggressively over recent trading sessions. The precious metal succumbed to powerful selling pressure earlier this month, sending gold price action on a 10% drop from its all-time high on 06 August, but the move looks more like a healthy correction rather than a reversal of the broader bullish trend.
| Change in | Longs | Shorts | OI |
| Daily | 1% | -3% | -1% |
| Weekly | 2% | -8% | -2% |
GOLD PRICE CHART: DAILY TIME FRAME (13 MAY TO 28 AUG 2020)
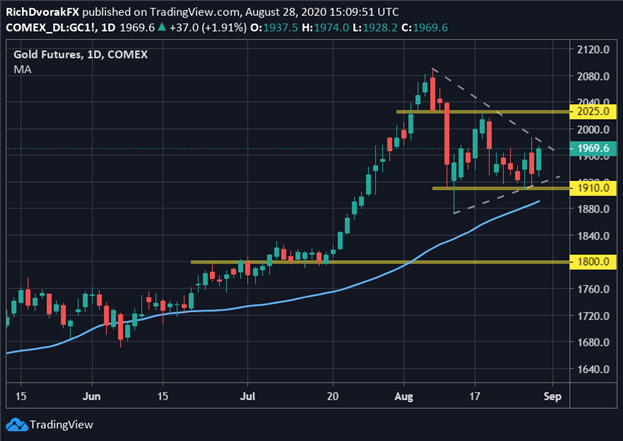
Chart created by @RichDvorakFX with TradingView
A breakdown below the 50-day moving average, however, might indicate gold bulls have capitulated. That said, after building a base of technical support around the $1,910-level over the last two weeks, gold prices look like they have potential to rebound back higher.

Perhaps a topside breakout from the symmetrical triangle consolidation pattern could provide confirmation of this. Nonetheless, the $2,025-price level and pivot point from last week’s swing high present two obstacles that could prevent gold from recoiling back toward its record close.
GOLD PRICE CHART: DAILY TIME FRAME (27 MAR TO 28 AUG 2020)
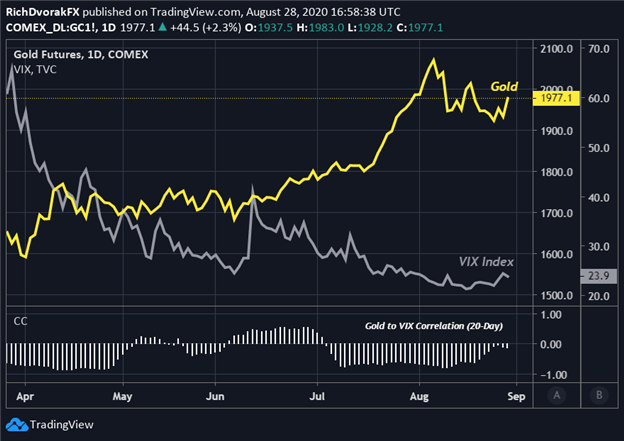
Chart created by @RichDvorakFX with TradingView
Still, even in spite of rising interest rates, the ‘path of least resistance’ for gold price action going forward seems skewed to the upside. This is on the coattails of average inflation targeting just announced by the Federal Reserve. Broadly speaking, alterations made to the Fed policy framework look to weigh positively on inflation expectations and pressure real yields even lower.

Downside risk stemming from a material flareup in expected stock market volatility could create headwinds for gold prices, however, and if materialized, potentially eat away at the precious metal’s roughly 30% year-to-date gain. Though it is worth mentioning that the gold to S&P 500 VIX Index correlation has turned considerably less negative throughout August.
Keep Reading: Gold Price Forecast Bright & Volatile as USD, Real Yields Swing
-- Written by Rich Dvorak, Analyst for DailyFX.com
Connect with @RichDvorakFX on Twitter for real-time market insight


