


CAD Analysis and Talking Points
- USD/CAD | Path of Least Resistance is Lower
- Canadian Dollar Shorts at Risk of Unwind
- Canadian Dollar Technical Levels
USD/CAD | Path of Least Resistance is Lower
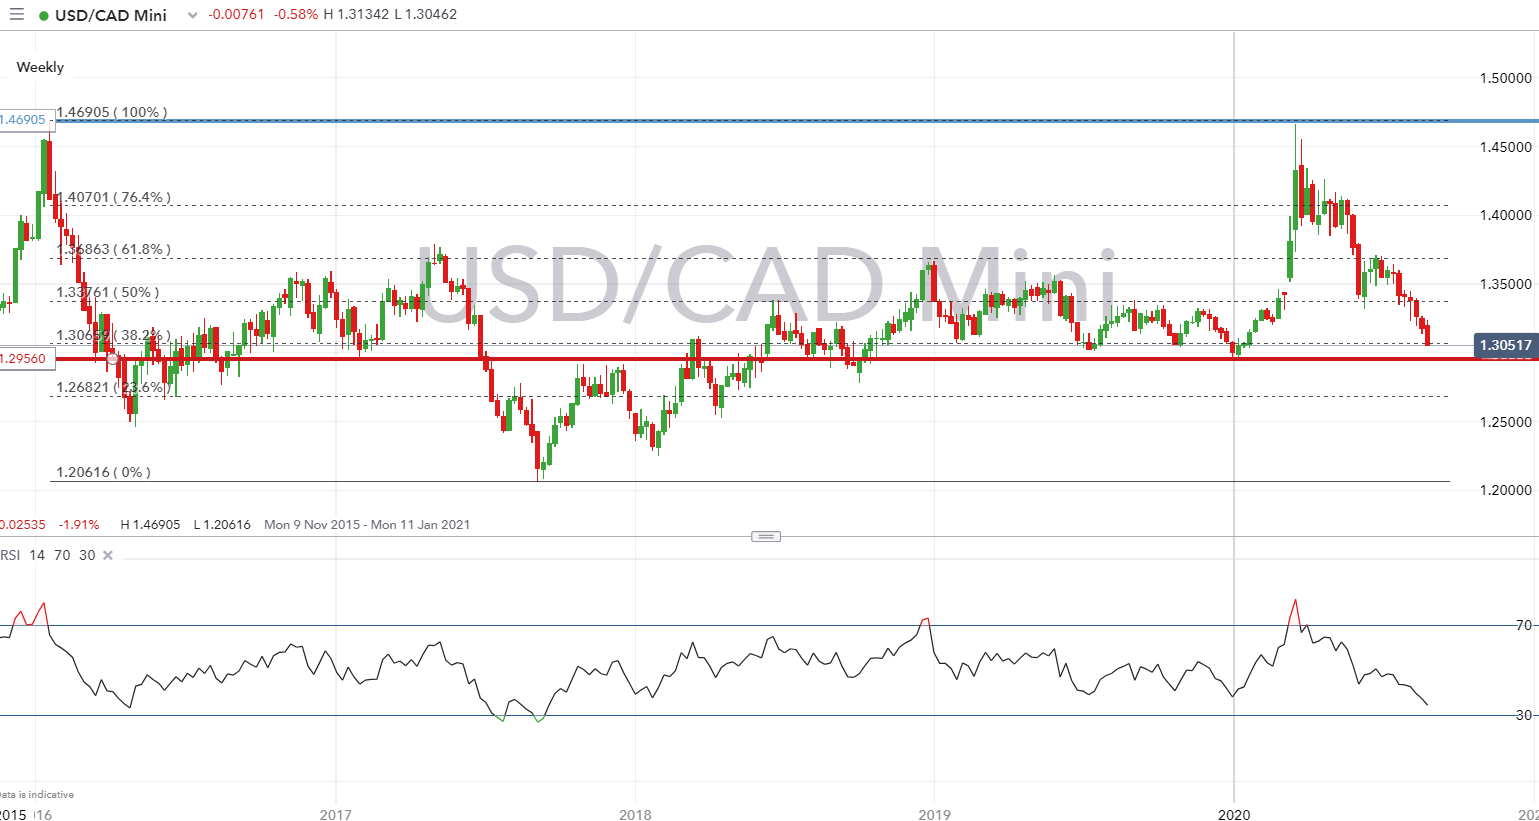
The Canadian Dollar is on the front against the US Dollar with USD/CAD finally breaking support at 1.3135. Yesterday’s Fed announcement had been as expected with Jay Powell confirming average inflation targeting, albeit the policy change had a level of ambiguity to it, which is likely to be cleared up at the September FOMC meeting. The drop in USD/CAD is largely based on the USD equation with the Canadian Dollar in fact weaker against its other counterparts. Month-end rebalancing is the usual suspect, which has exacerbated the declines in the greenback.
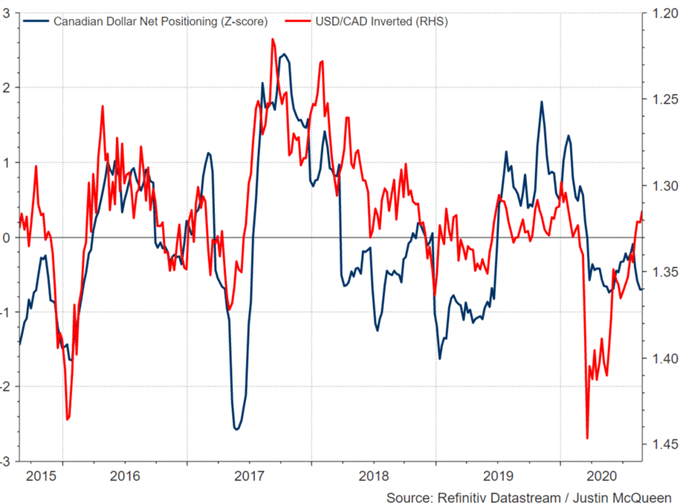
However, the path of least resistance for USD/CAD remains lower, while the consensus trade seems to be that the Loonie is in need of playing catch up with the rest of G10 FX. In turn, 1.3000 is the obvious target on the downside with risks of an extension to yearly low at 1.2956.Alongside this, positioning remains short on the Loonie and thus an extension of losses in USD/CAD risks being further exacerbated by an unwind bearish bets.
Canadian Dollar Shorts at Risk of Unwind
| Support | Resistance | ||
|---|---|---|---|
| 1.3000 | - | 1.3150 | - |
| 1.2956 | 2020 Low | 1.32 | |
| 1.2956 | 1.3250 |
Canadian Dollar Muted Response to Outdated GDP
Unsurprisingly, the Canadian Dollar saw a very muted reaction to the Q2 GDP data given its backward looking view of the economy . While the data confirms a record contraction (Q2 GDP -38.7% annualised), focus is on the path of the recovery as opposed to the depth of the crisis. For the meanwhile, US Dollar selling is the dominant theme across the FX space.
DailyFX Economic Data and Events Calendar
USD/CAD Price Chart: Weekly Time Frame
| Change in | Longs | Shorts | OI |
| Daily | -2% | 7% | 5% |
| Weekly | -30% | 38% | 13% |
Source: IG Charts


