


Gold, XAU/USD, Technical Analysis, Bullion – Talking Points:
- Gold may turn higher in the coming days as it carves out several bullish continuation patterns on multiple different timeframes.
- Could the Federal Reserve’s Jackson Hole Economic Symposium trigger a surge in the price of the precious metal?
Gold prices have remained relatively resilient in the wake of climbing bond yields and a tentative US Dollar rebound. This suggests the precious metal may turn higher in the near term as it carves out bullish continuation patterns on multiple timeframes.
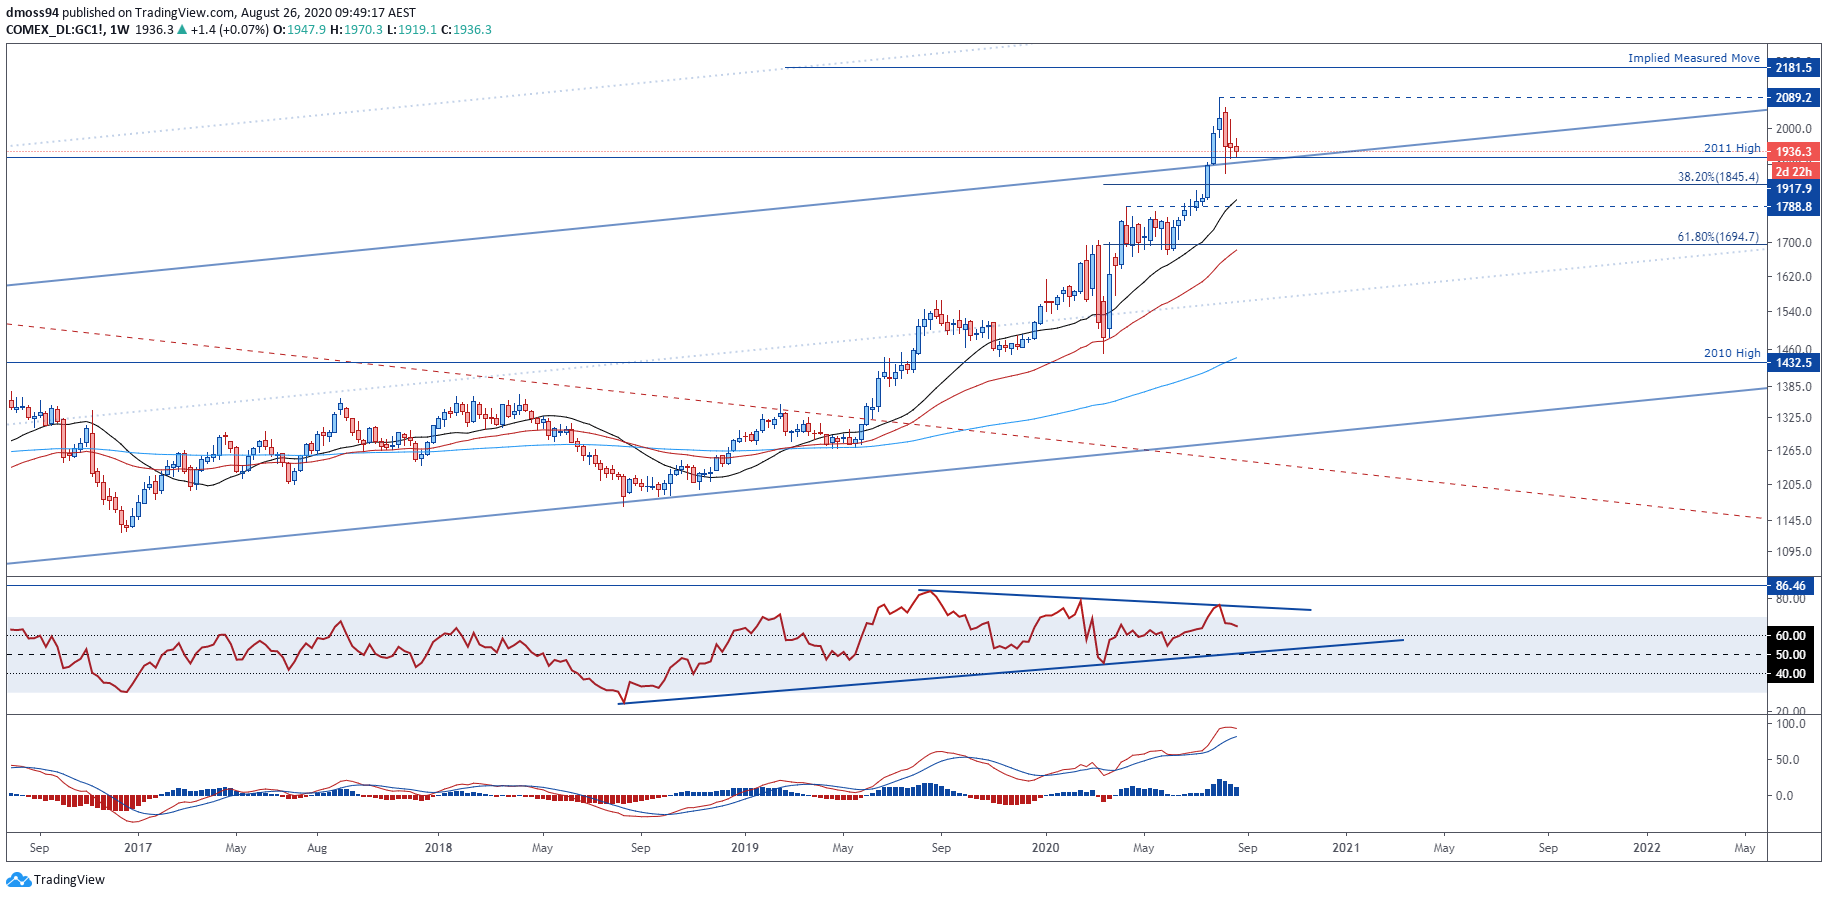
Gold Futures Monthly Chart – Confluent Support Stifling Downside Pressure

Gold futures (GC) monthly chart created using TradingView
Since breaking out of the 10-year Descending Triangle pattern in June 2019 gold prices have surged as much as 60% and remain constructively positioned above key support at the 2011 high (1917.9). The price of the precious metal soared to a fresh record high (2089) earlier this month before reversing just short of fulfilling the implied measured move (2180).
However, with the RSI flopping ahead of its 2008 extremes and a Shooting Star reversal candle forming below the 61.8% Fibonacci expansion (2077.8), there is a possibility that price may extend its recent slide lower.
Having said that, confluent resistance-turned-support at the 2011 high (1917.9) and Schiff Pitchfork median line appears to be suppressing selling pressure for the time-being and may validate the bullish breakout if buyers continue to protect the 1900 level.
A monthly close above the $2000/oz mark would probably signal the resumption of the primary uptrend and carve a path for price to test the Descending Triangle’s implied measured move (2180) and the 261.8% Fibonacci (2276.9).

Gold Futures Weekly Chart – Bull Flag Hints at Further Upside
Gold futures (GC) weekly chart created using TradingView
Jumping into the weekly timeframe suggests that although price has retreated throughout the month of August, the path of least resistance remains skewed to the upside as bullion consolidates in a Bull Flag pattern above the $1900/oz mark.
The steepening slopes of the 21-, 50- and 200-day moving averages indicate swelling bullish momentum and may encourage would-be buyers as the RSI continues to hover above 60.
However, the ‘faster’ MACD line looks to be gearing up to cross below its ‘slower’ signal line counterpart, hinting that a period of sustained consolidation is in the offing.
Nevertheless, gold prices may likely turn higher, as long as confluent support at the 2011 high and Schiff Pitchfork median line continue to negate selling pressure.
A retest of the yearly high (2089.2) would probably coincide with the RSI edging back into overbought territory and could see price test the measured move (2181.5) implied by the topside break of the decade-long Descending Triangle formation.
Gold Futures Daily Chart – Yearly Uptrend Guiding Price

Gold Futures (GC) daily chart created using TradingView
Zooming into daily price action reinforces the long-term bullishness reflected on higher timeframes as bullion prices continue to respect the uptrend extending from the March low (1450.9), despite sliding below the 21-DMA (1980) and failing to break above the $2000/oz level.
Although the RSI has notably declined since the start of the month it has yet to cross below 40, which could suggest underlying exhaustion in the recent pullback from the record high set on August 7 (2089.2).
Having said that, price is perched precariously above key support at the 2011 high as the MACD indicator extends its slide towards negative territory.
A break back below the August 11 swing-low (1911.3) would likely ignite a sustained correction, possibly bringing the 38.2% Fibonacci (1845.4) and 1800 level into play.
On the other hand, gold prices may accelerate back towards the yearly high (2089.2) if buyers can overcome 21-DMA resistance and the $2000/oz mark.
| Change in | Longs | Shorts | OI |
| Daily | 1% | -3% | -1% |
| Weekly | 2% | -8% | -2% |
-- Written by Daniel Moss, Analyst for DailyFX
Follow me on Twitter @DanielGMoss


