


The descending triangle (also known as the ‘falling triangle’) is one of the top continuation patterns that appears mid-trend. Traders anticipate the market to continue in the direction of the larger trend and develop trading setups accordingly.
Descending triangle main talking points:
- Definition of a descending triangle
- Identifying a descending triangle pattern on forex charts
- How to trade the descending triangle
- Advantages and limitations of the descending triangle

Test your knowledge of forex patterns with our interactive Forex Trading Patterns quiz
What is a descending triangle?
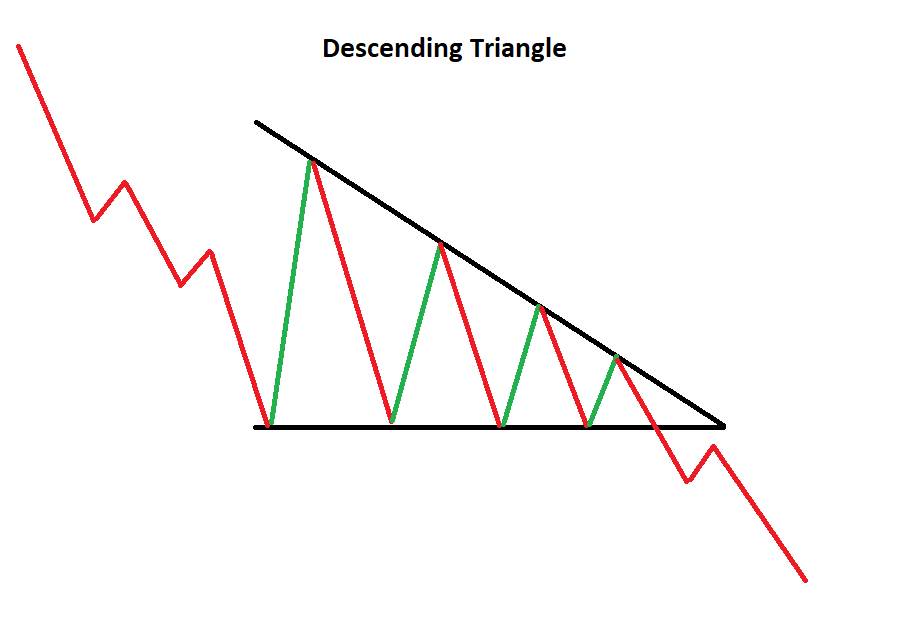
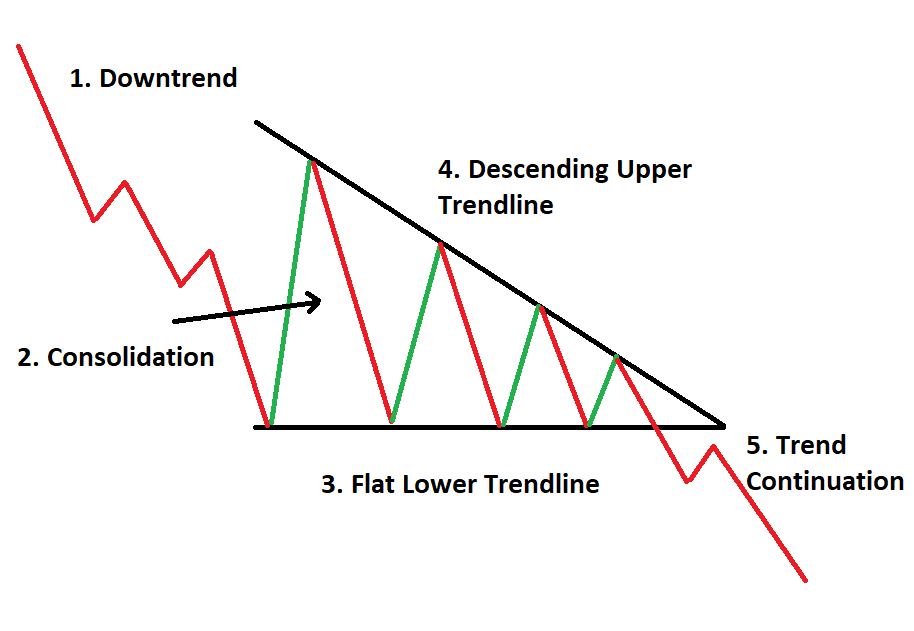
The descending triangle is a bearish pattern that is characterized by a descending upper trendline and a flat lower trendline that acts as support. This pattern indicates that sellers are more aggressive than buyers as price continues to make lower highs. The pattern completes itself when price breaks out of the triangle in the direction of the overall trend.
How to identify a Descending Triangle Pattern on Forex Charts
The descending triangle is fairly easy to spot once traders know what to look for. The below method can be applied to all financial markets as well as forex.
- Downtrend: The market must be in a downtrend before the descending triangle pattern appears. This is important and emphasises that traders should not simply trade the pattern whenever the descending triangle appears.
- Consolidation: The descending triangle then appears while the market enters the consolidation phase.
- Upper trendline: While the market is consolidating, a downward sloping trendline can be drawn by connecting the highs. This downward sloping trendline shows that sellers are slowly pulling the price down – which provides further support for a bearish trading bias.
- Lower trendline: The lower trendline acts as support. Price often approaches this level and bounces off until the breakout eventually occurs.
- Trend continuation: After price posts a strong break below the lower trendline, traders will look for confirmation of the pattern via continued downward momentum.
Descending Triangle Measuring Technique
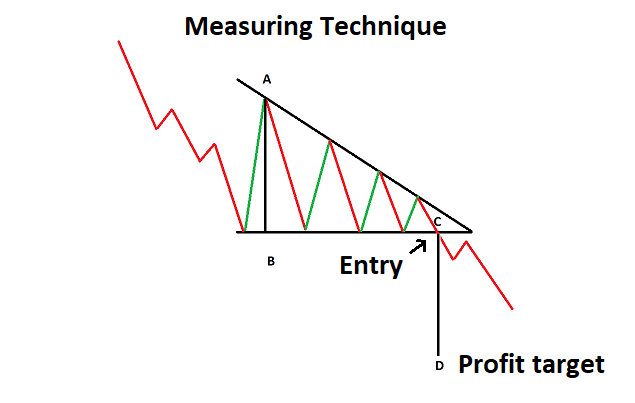
The descending triangle, often referred to as the ‘falling triangle’, has an inherent measuring technique that can be applied to the pattern to gauge likely take profit targets.
For the descending triangle,traders can measure the distance from the start of the pattern, at the highest point of the descending triangle to the flat support line. That same distance can be transposed later on, starting from the breakout point and ending at the potential take profit level.
The illustration below shows the distance from A to B can be transferred lower down, from C to D, in order to project a possible take profit level.
How to Trade the Descending Triangle
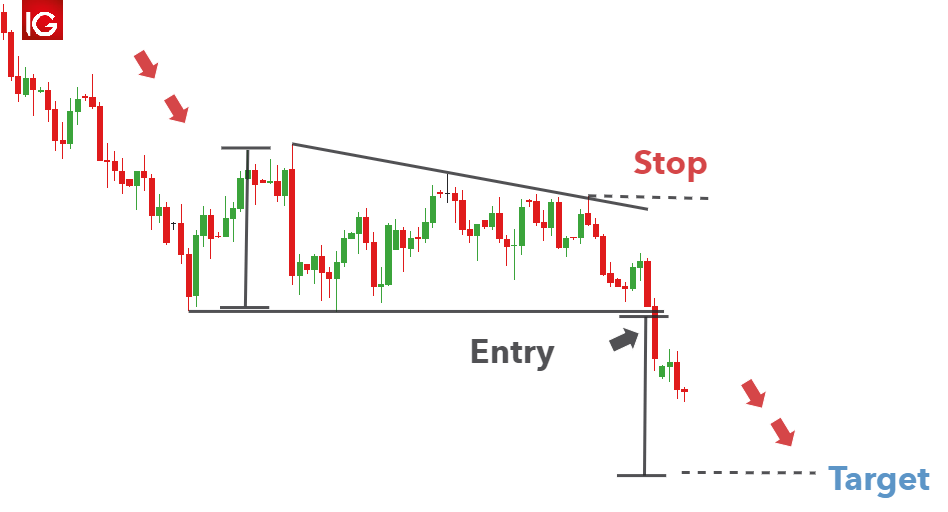
When trading the descending triangle, traders need to identify the downtrend and this can be seen in the EUR/USD chart below. Thereafter, the descending triangle appears as the forex candlesticks start to consolidate. The measuring technique can be applied once the triangle forms, as traders anticipate the breakout.
After viewing a strong break below support, traders can enter a short position, setting a stop at the recent swing high and take profit target in line with the measuring technique.
Advantages and Limitations of the Descending Triangle
The descending triangle pattern can be a great indicator of trend continuation, but it does have its limitations too:
| Advantages | Limitations |
|---|---|
| Easy pattern to identify | False breakouts are possible (traders need to manage risk accordingly) |
| The descending triangle produces a clear target level – based on the max height of the descending triangle | There is always a chance that price moves sideways for an extended period of time or even moves higher |
| Since this is an intermediate-term pattern, traders have the option to trade within the triangle but should filter trades in the direction of the trend |
Further Reading on Forex Trading Patterns
- The descending triangle is one of the top continuation patterns and forms part of the 3 triangle patterns every forex trader should know.
- To test your understanding of forex trading patterns, take our forex trading patterns quiz.
- If you are just starting out on your trading journey it is essential to understand the basics of forex trading in our free New to Forex trading guide.