


Silver, XAG/USD, Commodities, Monetary Policy, FOMC, US Treasury – Talking Points:
- Silver prices have stormed 150% higher in just over 5 months, after collapsing to their lowest level in over 11 years in March.
- Record low interest rates and a significantly weaker US Dollar fueled the silver metal’s breakout in 2020.
- Silver futures carving out a Bull Flag pattern just shy of key resistance, gearing up for another leg higher?
I think it's fair to say that 2020 has proven to be a breakout year for silver as it stepped out of the shadows of its more-popular gold counterpart, surging as much as 150% from its yearly low in comparison to bullion’s 43% climb.
Record low interest rates, accommodative monetary policy and extraordinary fiscal stimulus have buoyed precious metal prices and created the perfect environment for non-yielding assets to outperform.
However, the recent recovery in bond yields on the back of the US Treasury Department announcing that it would substantially increase its “10-year note auctions by $6 billion, the just-implemented 20-year bond auctions by $5 billion and 30-year bond auctions by $4 billion”, temporarily disturbed the ‘goldilocks’ environment nurturing the precious metal market.
The significant rise in supply weighed on longer-term bond prices and in turn ignited an aggressive reversal in silver, as it collapsed almost 22% in only four days whilst US 10-year Treasury Note yields soared 22 basis points.
Although the Treasury “will issue $108 billion of 10-year notes, $69 billion of 20-year bonds and $72 billion of 30-year bonds over the next three months” it’s unlikely that yields will continue to rise, given the Federal Reserve’s commitment to “increase its holdings of Treasury securities an agency residential and commercial mortgage-back securities at least at the current pace to sustain smooth market functioning”.
With that in mind, silver may extend its climb to multi-year highs if the central bank continues to cap the potential upside for bond yields.
Gold/Silver Ratio vs Silver Spot Prices (YTD)
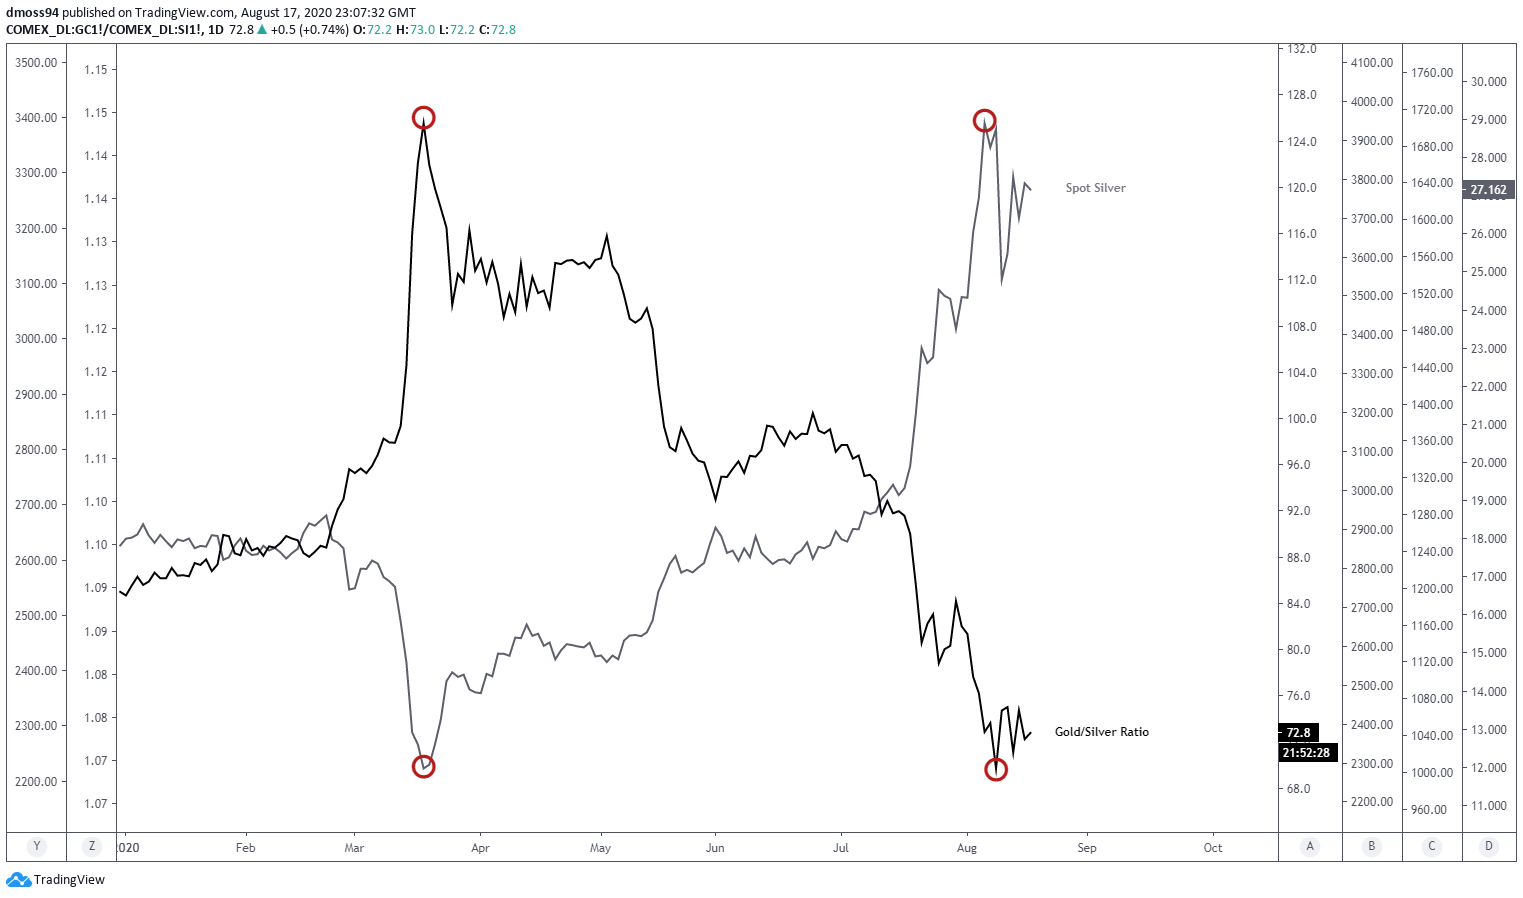
Gold/Silver ratio daily chart created using TradingView
The gold/silver ratio has displayed a strong inverse relationship with silver prices and could be signalling a period of consolidation for the precious metal, as it fails to overcome support at the monthly low (69.3).
Bullish RSI divergence hints at exhaustion in the ratio’s recent decline to its lowest level in three years and may potentially generate a recovery back towards Descending Channel resistance and the 2018 low (75.7).
Moreover, the ‘faster’ MACD line has crossed above its ‘slower’ counterpart, suggesting growing bullish bias and reinforcing the development of its technical counterpart.
Nevertheless, price remains encapsulated by a bearish Descending Channel, that may continue to direct the gold/silver ratio back towards the yearly low (69.3).
With that in mind, a daily close below the August low (69.3) is needed to validate bearish potential and would probably coincide with an impulsive surge in silver prices.
Conversely, a breach of key resistance at the 2018 low (75.7) and 21-day moving average (77.6) could see the ratio storm towards the 2016 high (83.4). More than likely, this may trigger a marked correction in the price of the silvery metal.
Gold/Silver Ratio Daily Chart
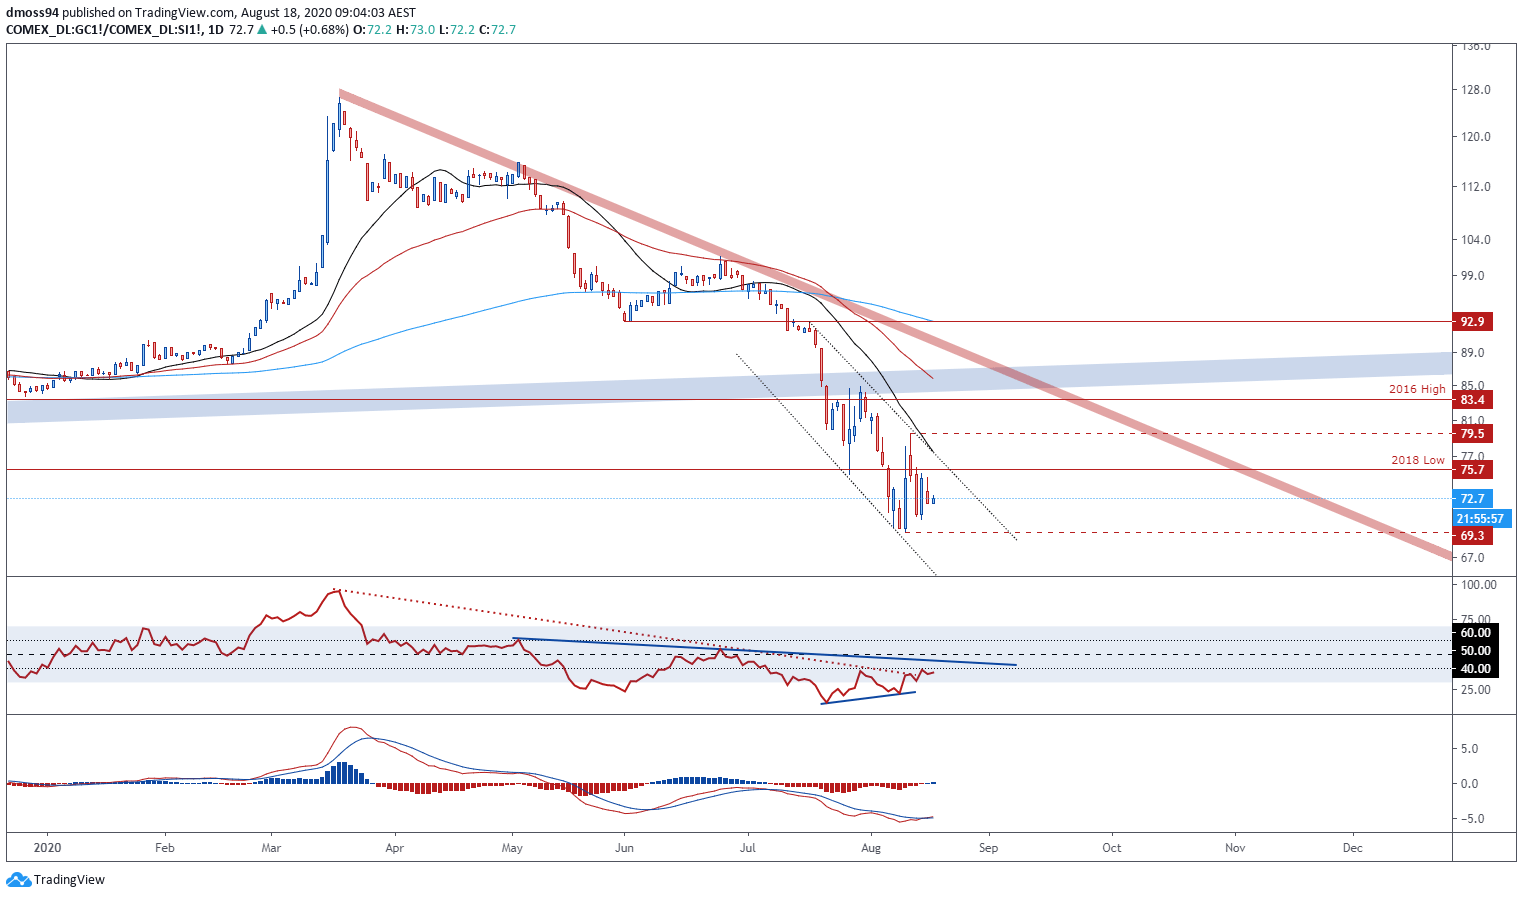
Gold/Silver ratio daily chart created using TradingView
Silver Futures Daily Chart – Bull Flag Hints at Extension
Jumping into the price of silver itself, it appears a Bull Flag pattern is being carved out just below pivotal resistance at the 1980 open (30.50), suggesting an impulsive move to the topside is on the cards if buyers can overcome support at the February 2013 weekly-close low (28.49).
Although RSI has retreated from overbought territory in recent days it remains constructively perched above 60 whilst the MACD indicator levitates at its highest daily levels since April 2011.
Nonetheless, price looks set to oscillate between flag resistance and support, if its unable to climb above the monthly high (29.91).
It may potentially grind back towards the September 1980 high (24.18) and the uptrend extending from the yearly low (11.64) before gearing up for a renewed push to test the psychologically pivotal $30/oz level.
Having said that, recent pullbacks have been fleeting in nature. Therefore, traders should monitor the development of the RSI as it flirts with a re-entry into overbought territory.
A successful climb above 30 more than likely to coincide with silver breaking to fresh yearly-highs.
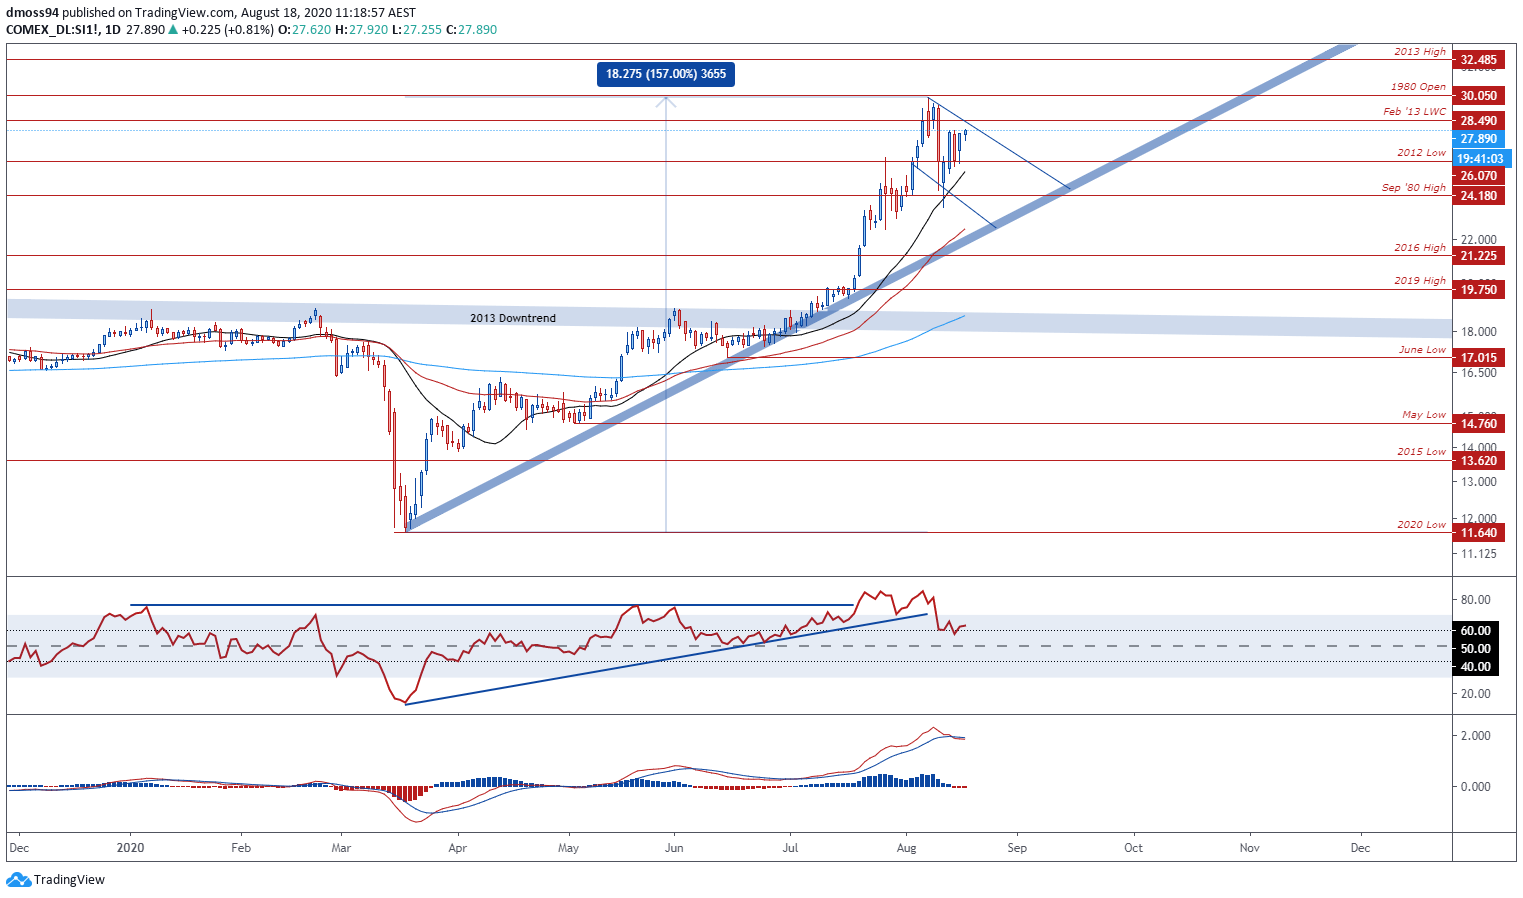
Silver futures (SI) daily chart created using TradingView
-- Written by Daniel Moss, Analyst for DailyFX
Follow me on Twitter @DanielGMoss


