


FTSE 100 Price, Chart and Analysis:
- A positive month for the FTSE as bulls take control.
- IG client sentiment hints at further upside.

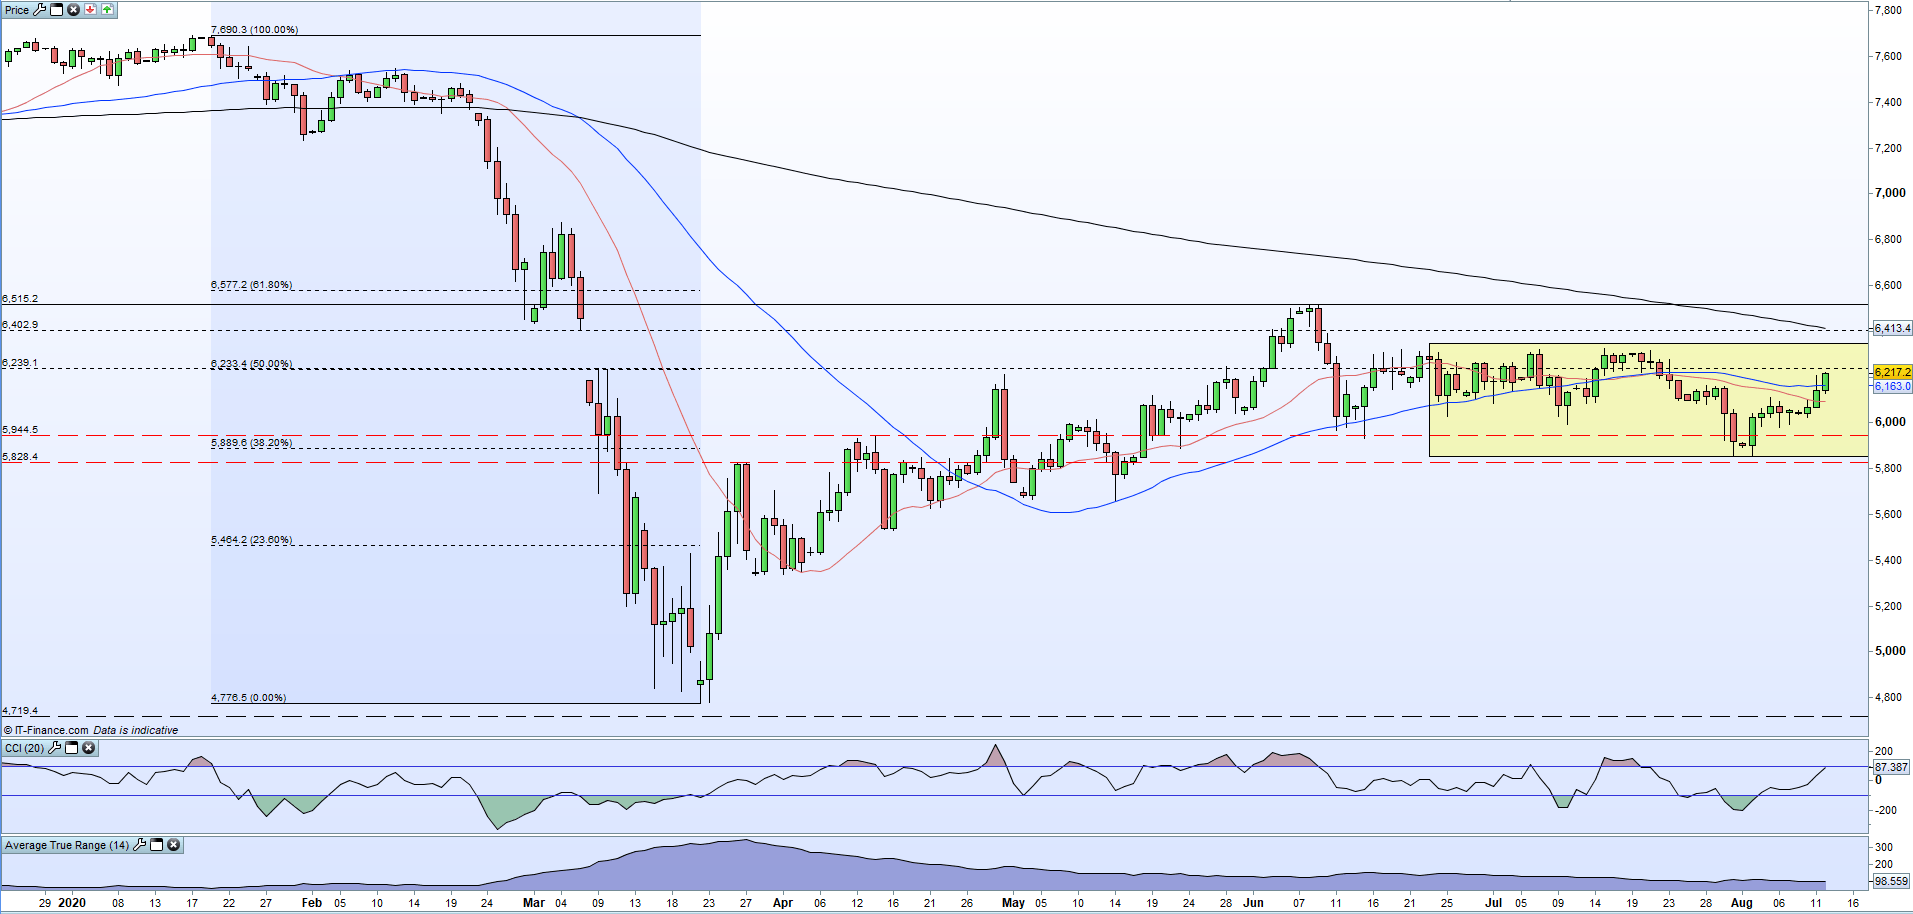
The UK big board continues to stair-step higher in August after hitting a multi-month low at 5,854 at the end of July/start of August. Recent price action has pushed the index back above the 20- and 50-day moving averages and now targets both the 50% Fibonacci retracement of the COVID-19 sell-off at 6,233 and the top of the recent trading range at 6,346. This trading range has held for the last six weeks and while the topside may be coming under threat, the FTSE 100 will need a strong driver if it is to make a confirmed break higher. Volatility (ATR) remains low during the Summer lull, while the CCI indicator suggests that the recent move higher is starting to become stretched. If the market does continue higher, three areas of potential resistance appear at 6,413 (200-dma), the June multi-month high at 6,515, followed by the 61.8% Fib at 6,577, all difficult hurdles to overcome in a low vol environment.
For all market-moving data releases and events see the DailyFX Economic Calendar
How to Read a Candlestick Chart
FTSE 100 Daily Price Chart (January – August 12, 2020)
The latest IG Client Sentiment Report shows that retail traders are 60.96% net-long the FTSE 100 with the ratio of traders long to short at 1.56 to 1. We typically take a contrarian view to crowd sentiment, suggesting that the FTSE 100 may fall. However,traders are less net-long than yesterday and compared with last week. Recent changes in sentiment warn that the current FTSE 100 price trend may move higher despite the fact traders remain net-long.
| Change in | Longs | Shorts | OI |
| Daily | -30% | 25% | 2% |
| Weekly | -44% | 44% | 0% |
Traders of all levels and abilities will find something to help them make more informed decisions in the new and improved DailyFX Trading Education Centre
What is your view on the FTSE 100 – bullish or bearish?? You can let us know via the form at the end of this piece or you can contact the author via Twitter @nickcawley1.


