


EUR/JPY Price Analysis:
- EUR/JPY wading through long-term symmetrical triangle
- Previous 125.00 target breached
- IG Client Sentiment (IGCS) indecisive
INFLUENTIAL MACROECONOMIC BACKDROP PULLING THE STRINGS
The Euro has continued its strength against the Japanese Yen (JPY) despite poor GDP figures coming out of many of the Eurozone contained countries. Although depressed figures were forecasted, many nations produced worse than expected data which surprisingly has not deterred the Euro’s bullish momentum.
A few weeks ago I wrote a price forecast on EUR/JPY where a potential bull pennant has since filled out and surpassed the 125.00 psychological level. The Euro run has been immense to say the least, but how long can this upward impetus be sustained?
EUR/JPY: MONTHLY CHART
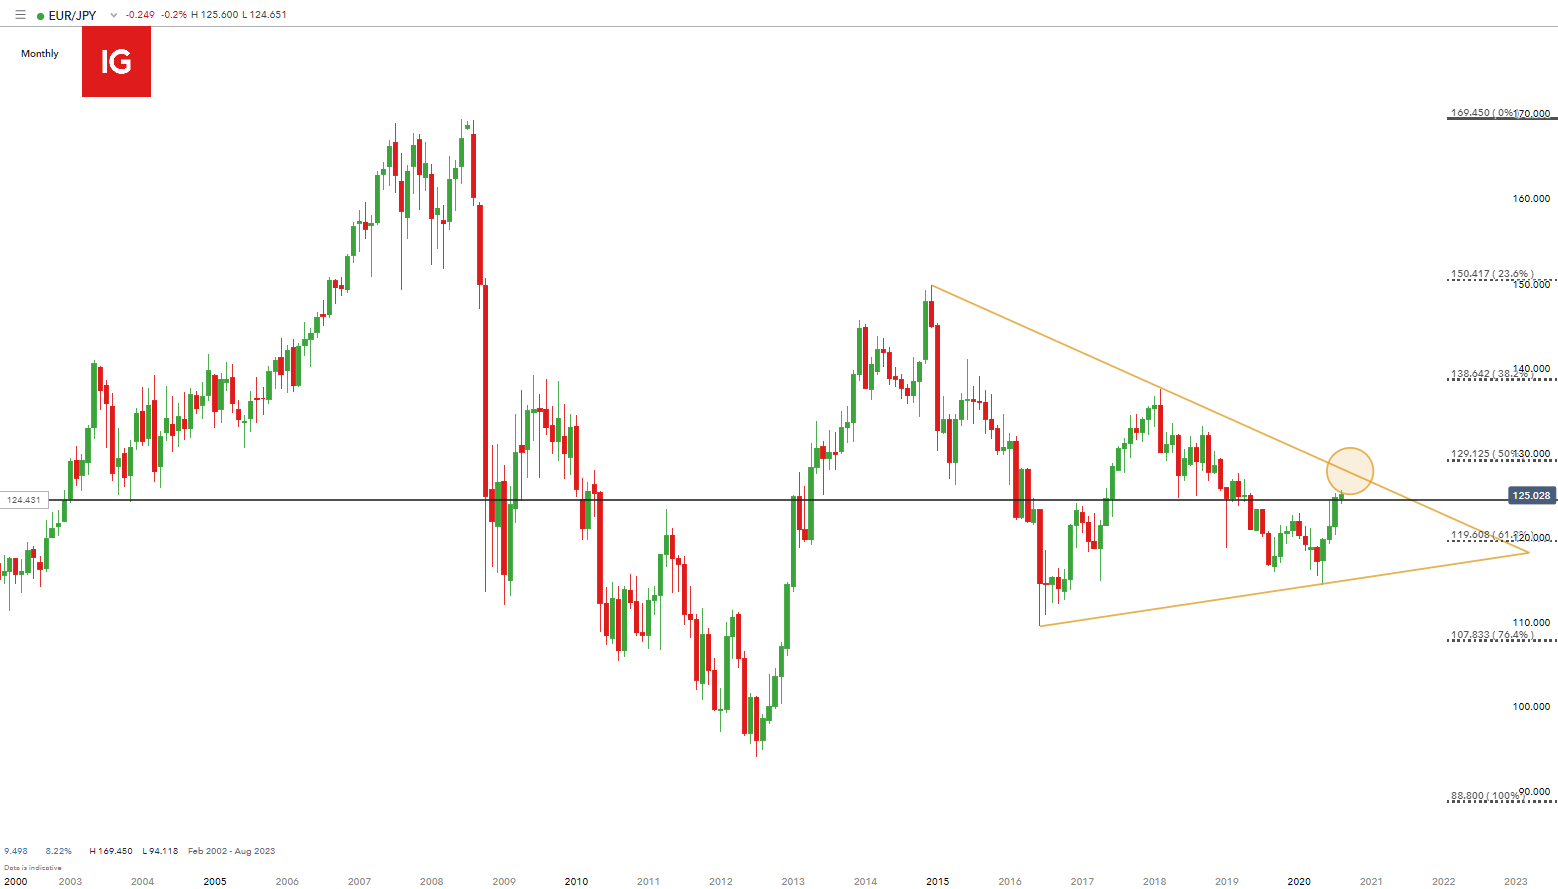
Chart prepared by Warren Venketas, IG
The long -term monthly chart above shows price action forming a multi-year symmetrical triangle (yellow). Price has been fairly respective of the chart pattern, which leans toward further upward price movement to topside resistance (yellow circle). The key 124.43 horizontal level (black) has been breached which could provide short-term support.
As we approach the apex of the triangle formation, traders may look to continue trading within the symmetrical triangle. This long-term neutral pattern may produce a breakout in either direction however, trader’s often favor the preceding trend as a bias for the impending breakout. Options traders may look for strangle or straddle strategies to exploit possible large market movements in either direction.
EUR/JPY: 4-HOUR CHART
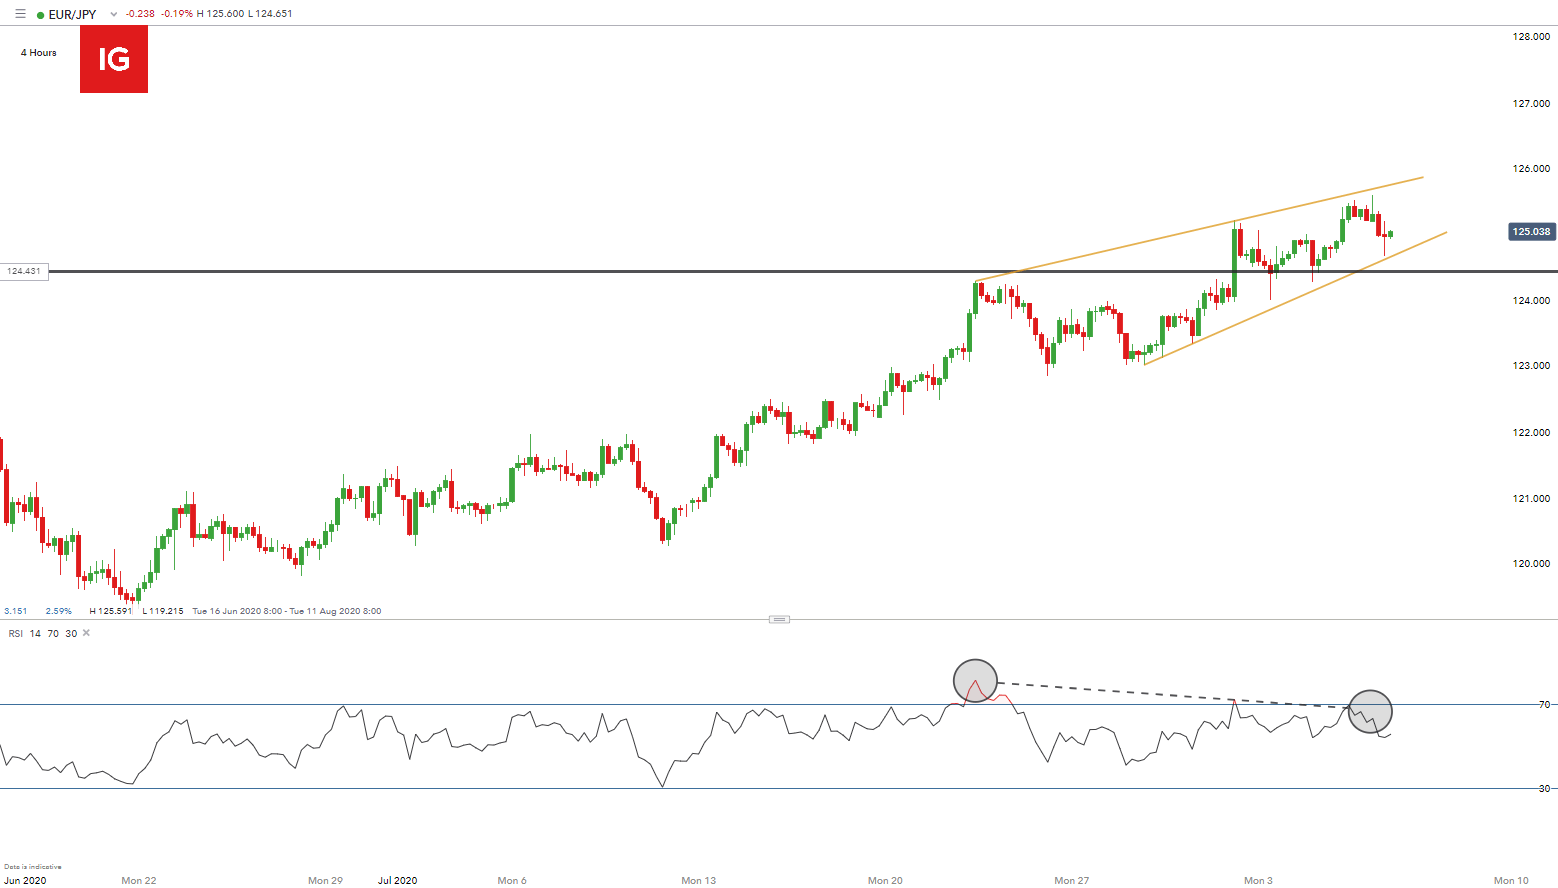
Chart prepared by Warren Venketas, IG
Dialing into the 4-hour chart, there is evidence of a strong uptrend with price trading within a rising wedge formation. This pattern is typically indicative of a bearish reversal when preceded by a downtrend which is not the case here, so caution is recommended before commitment.
An additional bearish signal can be seen from the Relative Strength Index (RSI) which presents bearish divergence whereby price is rising while the RSI is decreasing (black). This may fall in line with the descending upper trendline of the symmetrical triangle (monthly chart above) where price may revert lower once resistance is met. It is important to note that just because divergence is present does not mean price will reverse immediately, but may continue in a divergent state for a prolonged period of time as apparent thus far.
NON-FARM PAYROLLS ON THE HORIZON
The economic calendar has no high impact related announcements for the Eurozone or Japan over the next 7 days. Non-Farm Payrolls are scheduled tomorrow which should have some bearing on the pair although not directly related so trader’s should keep an eye for any large deviations from forecasts. With recent forecasts being significantly different from actual figures it would be no surprise if more of the same were seen tomorrow.


EUR/JPY STRATEGY MOVING FORWARD
Long-term price action points toward an extended bullish bias whilst acknowledging the boundaries of the symmetrical triangle chart pattern. A more granular look on the 4-hour chart will see traders anxiously awaiting the completion of the possible rising wedge formation.
Key trading points to consider:
- Monthly: 124.43; 4-Hour: Diagonal support
- Technical analysis – Daily: Symmetrical triangle; 4-Hour: Rising wedge and divergence
- NFP data release tomorrow
- IGCS data
IG CLIENT SENTIMENT INDEX SHOWS TUG OF WAR BETWEEN BULLS AND BEARS
| Change in | Longs | Shorts | OI |
| Daily | -9% | 0% | -3% |
| Weekly | 17% | -22% | -11% |
IGCS shows retail traders are currently marginally short on EUR/JPY, with 51% of traders currently holding short positions (as of this writing). This points to a mixed signal, which may need a technical or fundamental catalyst to give traders further guidance.
--- Written by Warren Venketas for DailyFX.com
Contact and follow Warren on Twitter: @WVenketas


