NZD/USD, NZD/JPY, Trans-Tasman Bubble, Tourism, New Zealand Economy – Talking Points:
- Deteriorating health outcomes in Australia have halted the planned implementation of a Trans-Tasman travel bubble, threatening New Zealand’s fragile economic recovery
- NZD/USD may break lower after forming a potential Double Top reversal pattern at key resistance.
- NZD/JPY poised to resume primary downtrend as it struggles to climb above the post-crisis highs.
The New Zealand Dollar may come under pressure in the coming weeks as Covid-19 cases surge in Australia, threatening the implementation of the trans-Tasman travel bubble.
It’s no secret that tourism is a major driver of the New Zealand economy and with international borders closed, the introduction of a travel bubble with Australia had been flagged as a potential remedy.
However, the inability to successfully supress the novel coronavirus in Australia has temporarily suspended the planned travel measures, leaving New Zealand Deputy Prime Minister Winston Peters “awfully frustrated” at Australian Prime Minister Scott Morrison for allowing “this thing to get out of control in my view”.
With tourism accounting for roughly $16.2 billion and contributing roughly 9.8% to GDP, it is understandable that the Deputy Prime Minister believes a moderated version of the trans-Tasman bubble may still be a possibility soon stating, “we used to fly between our two countries and states in the 1990s [and] we can do it again”.
Having said that, the implementation of this much-desired program looks to be highly unlikely given the current state of health outcomes in Australia with Victoria, Australia’s second most populous state, recently mandating the use of face masks in response to a record-breaking surge in Covid-19 cases.
To that end, the trade-sensitive New Zealand Dollar may struggle against its major counterparts as the tourism industry continues to be hampered by regional coronavirus concerns.
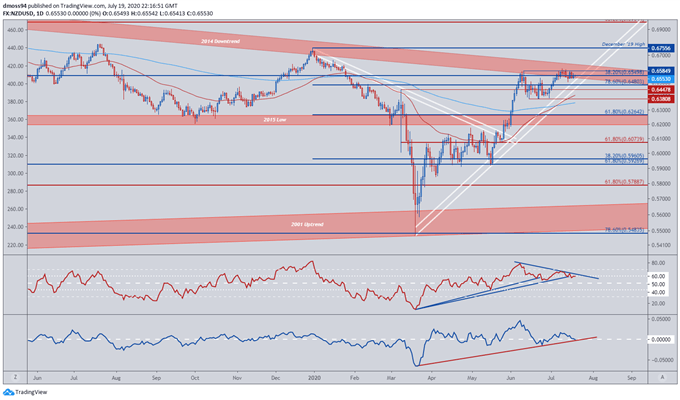
NZD/USD Daily Chart – Double Top Reversal in Play?

NZD/USD chart created using TradingView
From a technical perspective, the NZD/USD exchange rate looks poised for a reversal at key resistance as price carves out a potential Double Top just shy of the psychologically imposing 0.66 level.
Although a bullish crossover on the moving averages – the ‘faster’ 50-DMA crossing above the ‘slower’ 200-DMA – triggered a surge from the June low (0.6381) to fresh post-crisis highs, price was still unable to overcome the 2014 downtrend and 0.66 level suggesting the recent rally may be running out of steam.
Furthermore, the development of the RSI and Momentum indicators implies underlying weakness in NZD/USD rates as both technical studies fail to follow price higher, warning a potential change in trend direction is in the offing.
That being said, price looks set to slide back to support at the 78.6% Fibonacci (0.6480) and the uptrend extending from the yearly low (0.5469).
A daily close below the March high (0.6448) likely signalling a resumption of the primary downtrend, with key regions of support found at the June low (0.6380) and 61.8% Fibonacci (0.6264).
Conversely, a close above the monthly high (0.6601) may invigorate buyers, possibly carving a path to break above the 2014 downtrend and test the December high (0.6756).
| Change in | Longs | Shorts | OI |
| Daily | -9% | 10% | -3% |
| Weekly | -21% | 17% | -10% |
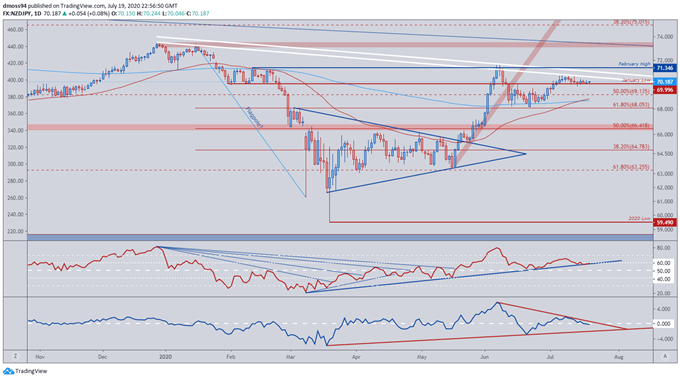
NZD/JPY Daily Chart – Primary Downtrend Back in Action?

NZD/JPY chart created using TradingView
Much like its NZD/USD counterpart, NZD/JPY appears ready to break lower as the downtrend extending from the yearly high (73.35) continues to serve as a pivotal inflection point for price, suppressing bullish potential and capping further upside.
Moreover, the RSI is floundering just before jumping into overbought territory is hardly a constructive sign for the risk-sensitive exchange rate, which may speak to intensifying selling pressure as the oscillator lurches below 60 to test its 4-month uptrend from the yearly extremes.
A daily close below the January low (69.99) may encourage sellers and probably open a path for a pull-back to the 200-day moving average (68.65), with a break through sentiment-defining support signalling a potential resumption of the longer-term downtrend and bringing the psychologically pivotal 68 level into play.
On the other hand, a break above the February (71.35) and June high (71.67) is needed to validate bullish potential and may result in a sustained push to test the yearly open (73.13).
-- Written by Daniel Moss, Analyst for DailyFX
Follow me on Twitter @DanielGMoss


