


ASX 200 Index, Australia-China Trade Tensions, National Security Law – Talking Points:
- Deterioration of Australia’s relationship with its largest trading partner, China, continues to hamper the performance of regional risk assets
- The ASX 200 stock indexcontinues to struggle at resistance as technical divergence hints at potential reversal. Is this the end of the road for the Australian benchmark index?
Australia-China Trade Tensions Capping Regional Risk Assets
Deterioration of Australia’s relationship with its largest trading partner, China, continues to hamper the ASX 200 index’s recovery from yearly lows, as it fails to break above key resistance at the 6,200 level.
This pivotal relationship has become increasingly strained in recent days with the Chinese Ministry of Foreign Affairs (MFA) upgrading their travel advice, reminding “Chinese citizens to be extra careful about the local security risks and be cautious about travelling to Australia in the near future”.
At the heart of the issue, Beijing’s imposition of a new national security law in Hong Kong, undermining the ‘One Country, Two System’ constitutional principle of the Special Administrative Region (SAR).
Representing a “fundamental change of circumstances” in the financial hub Prime Minister Scott Morrison’s condemnation of the laws, and subsequent termination of Australia’s extradition treaty with Hong Kong, has unsurprisingly ruffled Beijing’s feathers.
Data Source - Bloomberg
Moreover, the decision to extend visas and offer a pathway to permanent residency for some Hong Kongers was lambasted by the Chinese embassy in Canberra, claiming the “groundless accusations and measures announced by the Australian Government [are] a serious violation of international law and basic norms governing international relations, and a gross interference in China’s internal affairs”.
So far, the tit-for-tat exchanges have resulted in minimal economic repercussions for Australia with travel warnings hardly debilitating at the current moment in time as borders remain closed to international travellers for the foreseeable future.
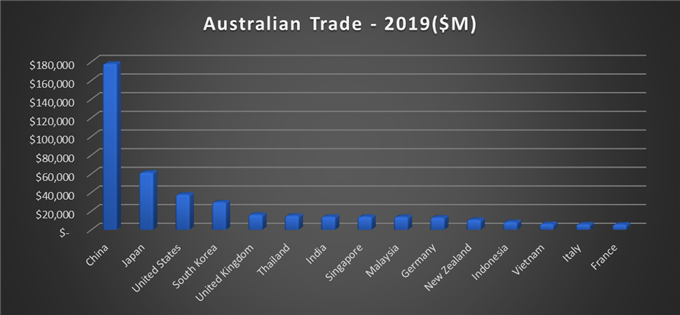
However, Beijing has warned of consequences for those who “interfere in [China’s] internal affairs” and may up the ante in terms of retaliation, with scope to target Australian exports having already imposed an 80% tariff on barley earlier this year.
Australian Exports by Category
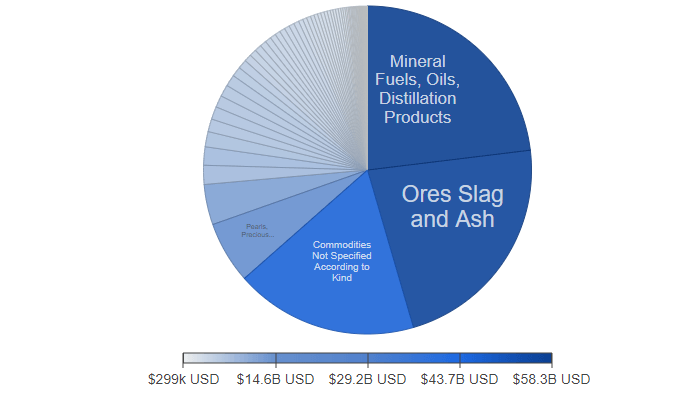
Source – Trading Economics
With China’s barley purchases in 2019 only accounting for $600 million, the targeted imposition of these tariffs served as a warning that outsiders meddling in “internal affairs” will be punished.
Continued escalation may force Beijing’s hand and could possibly lead to $80 billion worth of iron ore exports - that remain pivotal in underpinning the local economy – falling into the Asian powerhouse’s crosshairs.
To that end, the development of this pivotal relationship will be intently watched by market participants, with any form of retaliatory escalation potentially fueling a period of risk aversion and heavy discounting of regional risk assets.
ASX 200 Daily Chart – The RSI Hints at Potential Reversal at Key Resistance

ASX 200 daily chart created using TradingView
From a technical perspective, the ASX 200 index’s outlook remains skewed to the downside as resistance at the 61.8% Fibonacci continues to diffuse any form of bullish potential.
With the RSI tentatively breaking its constructive 4-month trend and price failing to hold above the psychologically imposing 6,000 level, a break below the uptrend extending from the June low (5,682) looks in the offing.
Although the slope of the 50-day moving average (5,792) is notably positive, the steepness has faded significantly over the past month of trade, reinforcing the lack of bullish impetus seen in recent price action.
A daily close below the 50% Fibonacci (5,792) would probably result in a sustained decline back to the 38.2% Fibonacci (5,461) and potentially signal a resumption of the yearly downtrend.
Conversely, a break above the 61.8% Fibonacci (6,124) and June high (6,198) may ignite a surge to test the March high (6,524), should buyers successfully overcome sentiment-defining resistance at the 200-day moving average (6,236)
-- Written by Daniel Moss, Analyst for DailyFX
Follow me on Twitter @DanielGMoss


