


HANG SENG INDEX, STRAITS TIMES INDEX, GOLD PRICE OUTLOOK:
- Hang Seng Index extends rally as tech gains. It faces an immediate resistance at 25,000
- Singapore’s PM announced a general election to be held on 10th July. Stocks consolidate
- Underpinned by a weaker US Dollar, gold pricesare extending gains to US$ 1767
Hang Seng Index Outlook:
Hong Kong’s Hang Seng Index stock market benchmark surged 1.6% yesterday, marking it one of the best performing indices across the Asia-Pacific region. The rally was mainly driven by technology giant Tencent (+4.89%), which accounts for around 11.2% of the index’s weight (table below). Financial stocks AIA (+2.46) and HSBC (+2.04%) were doing well too.
As discussed in an earlier report, the draft of Hong Kong’s security law is unlikely to bring a material impact to the Hang Seng Index, which is heavily weighted toward mainland corporations. In fact, the implementation of a national security may even help to contain violence in the street, and thus from a economic point of view, to bring social stability to the financial hub.
Technology firms, including Tencent, Meituan, Alibaba and JD.com have benefited from the Covid-19 pandemic, as more consumers seek e-commerce, gaming, streaming and other digital services. The rally in tech stocks shows no sign of ending soon.
US stock markets closed higher overnight, setting a positive tone for the Asia-Pacific open. Among the S&P 500 sectors, consumer discretionary (+1.04%), information technology (0.70%), communication (+0.61%) and health care (+0.44%) were the best performing ones, whereas utilities (-1.06%), real estate (-0.35%) and consumer staples (-0.14%) were lagging behind last night.
Hang Seng Index –Technical Analysis
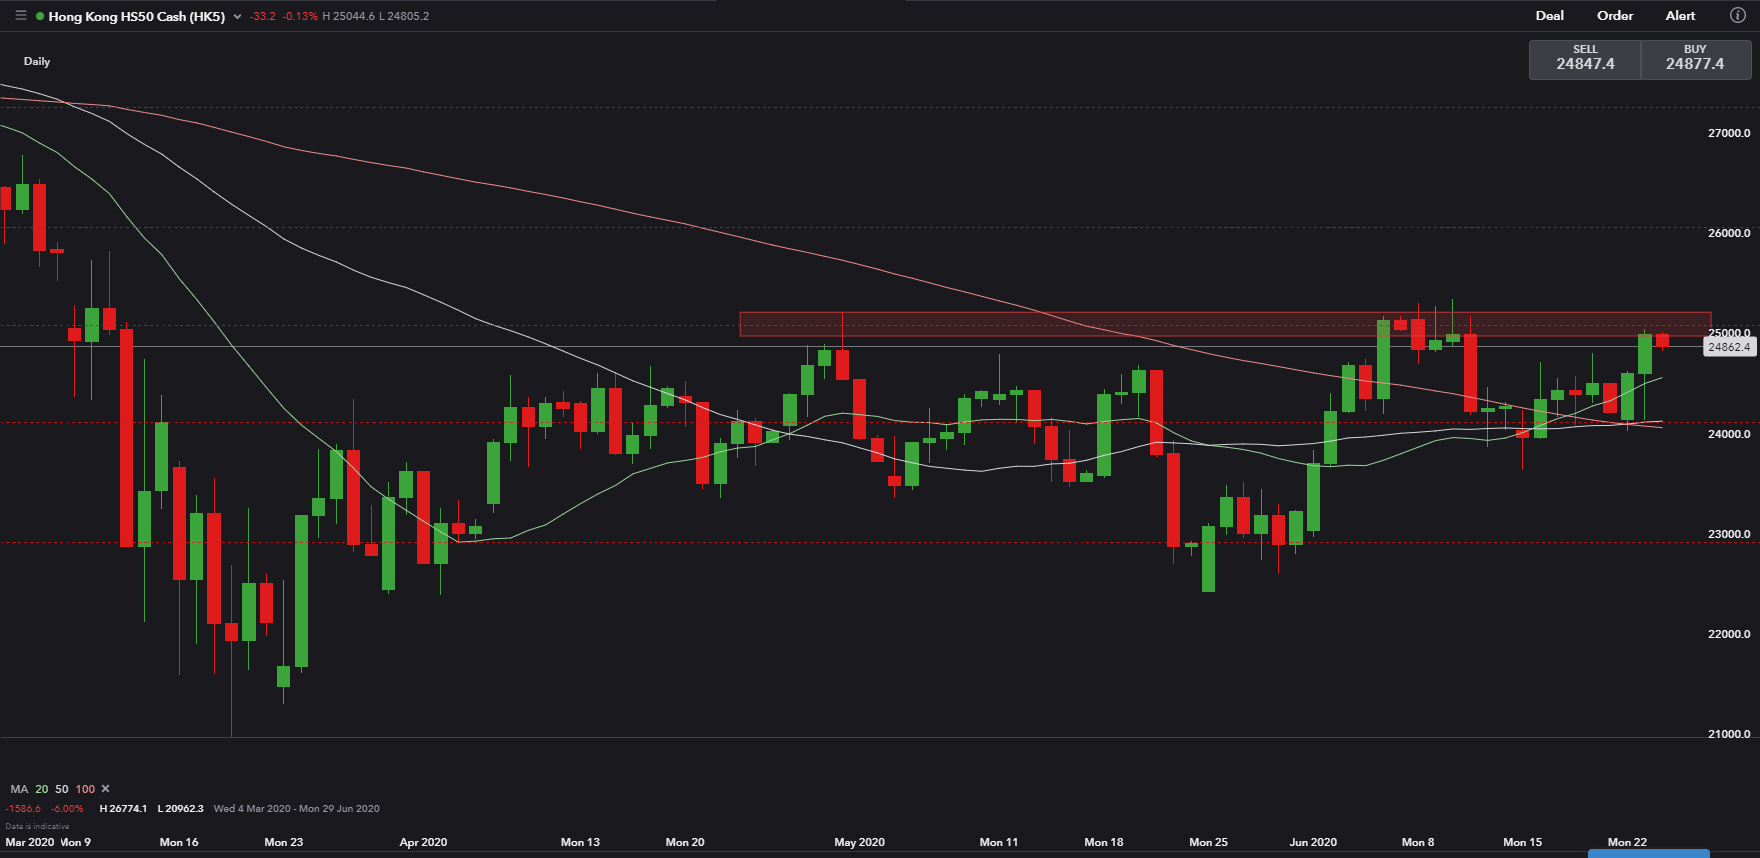
The Hang Seng Index is challenging a key resistance level at 25,000, which it failed to break above in early May and June. Will a tech rally empower it with momentum for a meaningful breakout? The next few days are critical.
The 20-day SMA has crossed above the 50- and 100-Day SMAs, signaling the formation of ‘golden cross’ should the price hold above 24,000. An immediate support level could be found at 24,100 – the 38.2% Fibonacci extension.
| Hang Seng Index Top 10 Constituent Stocks Performance 23-6-2020 | |||||||
|---|---|---|---|---|---|---|---|
| Stock code | Stock name | Close price | % Change | Dividend yield | P/E | Contribution to Index change | Weighting in HSI |
| 700 | TENCENT | 497.400 | +4.89 | 0.24 | 44.51 | +129.15 | 11.12 |
| 1299 | AIA | 74.900 | +2.46 | 1.69 | 17.32 | +63.23 | 10.56 |
| 5 | HSBC HOLDINGS | 37.450 | +2.04 | 6.28 | 16.14 | +46.92 | 9.41 |
| 388 | HKEX | 320.000 | +2.70 | 2.10 | 42.72 | +30.43 | 4.65 |
| 939 | CCB | 6.260 | +0.97 | 5.59 | 5.25 | +19.63 | 8.22 |
| 941 | CHINA MOBILE | 54.750 | +1.48 | 5.94 | 9.27 | +14.86 | 4.08 |
| 1177 | SINO BIOPHARM | 14.960 | +3.74 | 0.53 | 61.14 | +12.33 | 1.37 |
| 2 | CLP HOLDINGS | 77.350 | +2.11 | 3.98 | 41.96 | +9.17 | 1.78 |
| 27 | GALAXY ENT | 53.350 | +1.91 | 1.71 | 17.72 | +6.55 | 1.40 |
| 2313 | SHENZHOU INTL | 99.300 | +2.69 | 1.91 | 25.84 | +6.50 | 1.00 |
Source: hsi.com.hk, DailyFX
Hang Seng Index – Daily Chart
Straits Times Index:
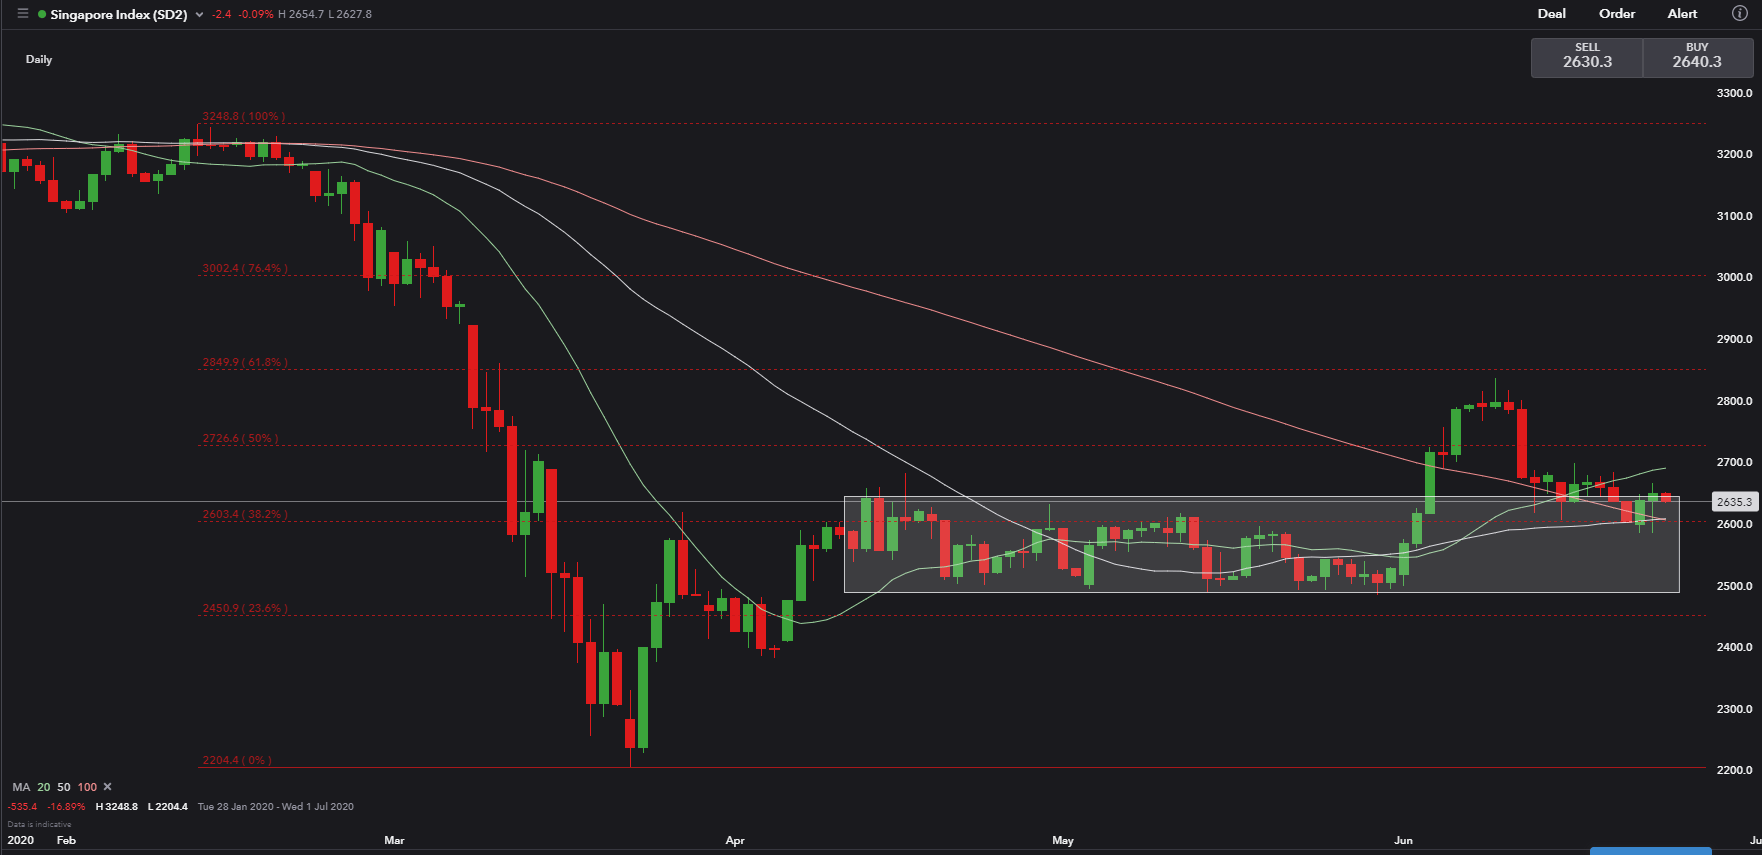
The Straits Times Index stock market benchmark has been consolidating at the 2,600-2,650 area for two weeks. Investors are cautious about a potential second viral wave in major economies and its ramification for the recovery in growth. SGX daily trading volume has also shrank alongside share prices, undermining risk appetite.
The announcement of a general election to be held on 10th July didn’t bring much of a surprise and volatility to Singapore’s stock market. An election now will give the new government a fresh five-year mandate to focus on imminent Covid issues and long term development plans.
Technically, the index has found a strong support at 2,600, where its 50- and 100-Day SMAs cross.
Gold:
Yesterday, gold price had a meaningful breakout above US$ 1,750 – a major resistance level. The rally seemed to have legs as the US Dollar Index continued to drift lower. Rising demand for inflation-hedge assets is probably another key driver behind gold prices.
Gold prices have likely broken out above an ‘Ascending Triangle’ after piercing through US$ 1,750. It has now opened room for more upside towards US$ 1,800 and then US$ 1,870 – the 161.8% Fibonacci extension. The MACD indicator suggests there could be more upside in the near term.
| Change in | Longs | Shorts | OI |
| Daily | 1% | -3% | -1% |
| Weekly | 2% | -8% | -2% |

--- Written by Margaret Yang, Strategist for DailyFX.com
To contact Margaret, use the Comments section below or @margaretyjy on Twitter


