British Pound (GBP) – GBP/USD Forecast, Chart and Analysis:
- Two-metre rule may be relaxed with mitigations.
- Sterling remains in the doldrums after support levels fell.


UK Health Secretary Set to Change Social Distancing Rule.
The UK government may announce a change to the current two-metre social distancing rule this week, according to health secretary Matt Hancock, as the government looks to ease lockdown measures further. According to reports, the two-metre rule is set to be reduced on July 4, allowing pubs and restaurants to re-open, providing a much needed boost for the UK economy. The health secretary, speaking to the BBC over the weekend, said that while he hoped to reduce the distance, the government would remain ‘guided by science’ to prevent any resurgence of the COVID-19 virus.
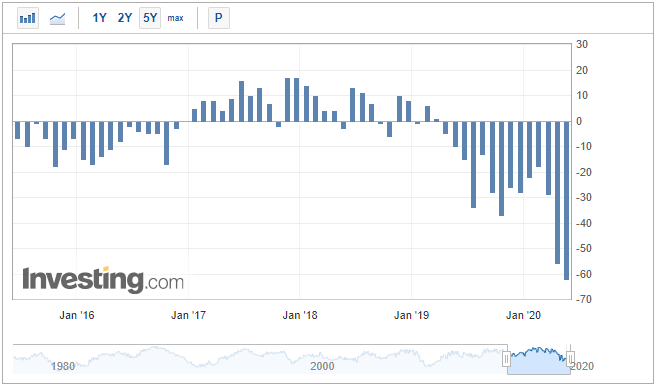
The latest CBI industrial trends survey (June) will be released at 11:00 UK and while this indicator is not normally a market mover, it is a closely watched indicator of business conditions. Any bounce back from last month’s dire reading of -62 may help underpin Sterling.

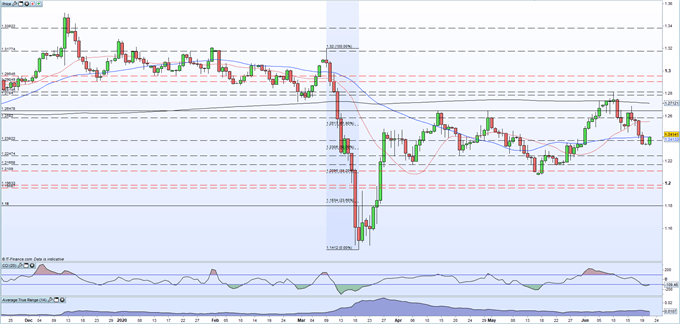
Sterling opens the week slightly higher after Friday’s sharp sell-off. GBP/USD is back above 1.2400 after printing a 1.2332 low in early turnover. The pair now need to break back above the 50-day moving average at 1.2414 before the 61.8% Fibonacci retracement at 1.2517 comes into play.
EUR/GBP currently trades around 0.9025 after touching a near three-month high of 0.9075 late Friday.
GBP/USD Daily Price Chart (November 2019 – June 22, 2020)

| Change in | Longs | Shorts | OI |
| Daily | 3% | -7% | -3% |
| Weekly | 4% | -10% | -5% |
Traders may be interested in two of our trading guides – Traits of Successful Traders and Top Trading Lessons – while technical analysts are likely to be interested in our latest Elliott Wave Guide.
What is your view on Sterling (GBP) – bullish or bearish?? You can let us know via the form at the end of this piece or you can contact the author via Twitter @nickcawley1.


