


RBNZ, NZD/JPY, NZD/CAD, NZD/CHF Talking Points:
- RBNZ expected to keep OCR steady at June 24 monetary policy meeting
- NZD recent appreciation running out of steam as fresh bout of risk aversion floods into financial markets
- NZD/CAD possible double top at key resistance; NZD/CHF at risk of breaking down;NZD/JPY holding at key support…for now
Attention turns to the Reserve Bank of New Zealand policy meeting this week, with an expectation that Governor Adrian Orr and the committee will keep the official cash rate (OCR) at the record low of 0.25%.
With gross domestic product (GDP) falling 1.6% in the first quarter of 2020, and expectations of a mind-boggling 17% contraction in the three months through June, the island nation is all but certain to enter its first recession since 2009.

Source – Reserve Bank of New Zealand (RBNZ)
Committing to “stand ready to deploy further tools as needed, should the need for stimulus continue to increase”, recent weak economic data and the continuing fallout from the coronavirus pandemic may force the hand of the RBNZ as the committee acknowledge “there are policy tools available that have not yet been used”.
Although Governor Orr has alluded to the deployment of a negative OCR as “an option in the future” it remains highly unlikely the central bank would implement such a policy as “at present, financial institutions are not yet operationally ready”.
However, there is potential for the central bank to continue to expand the current Large-Scale Asset Purchase (LSAP) programme to include “other asset classes, such as foreign assets”, after topping up the program from $33b to $60b to “reduce borrowing rates for New Zealanders” just last month.
Considering the central bank’s form for surprise cuts to the OCR, vis-à-vis the 50-basis-point cut in August 2019, the upcoming meeting may present an opportunity to surprise market participants once again as the “balance of economic risks remains to the downside”.
NZD Index Daily Chart – 2017 Downtrend Continues to Cap Potential Upside
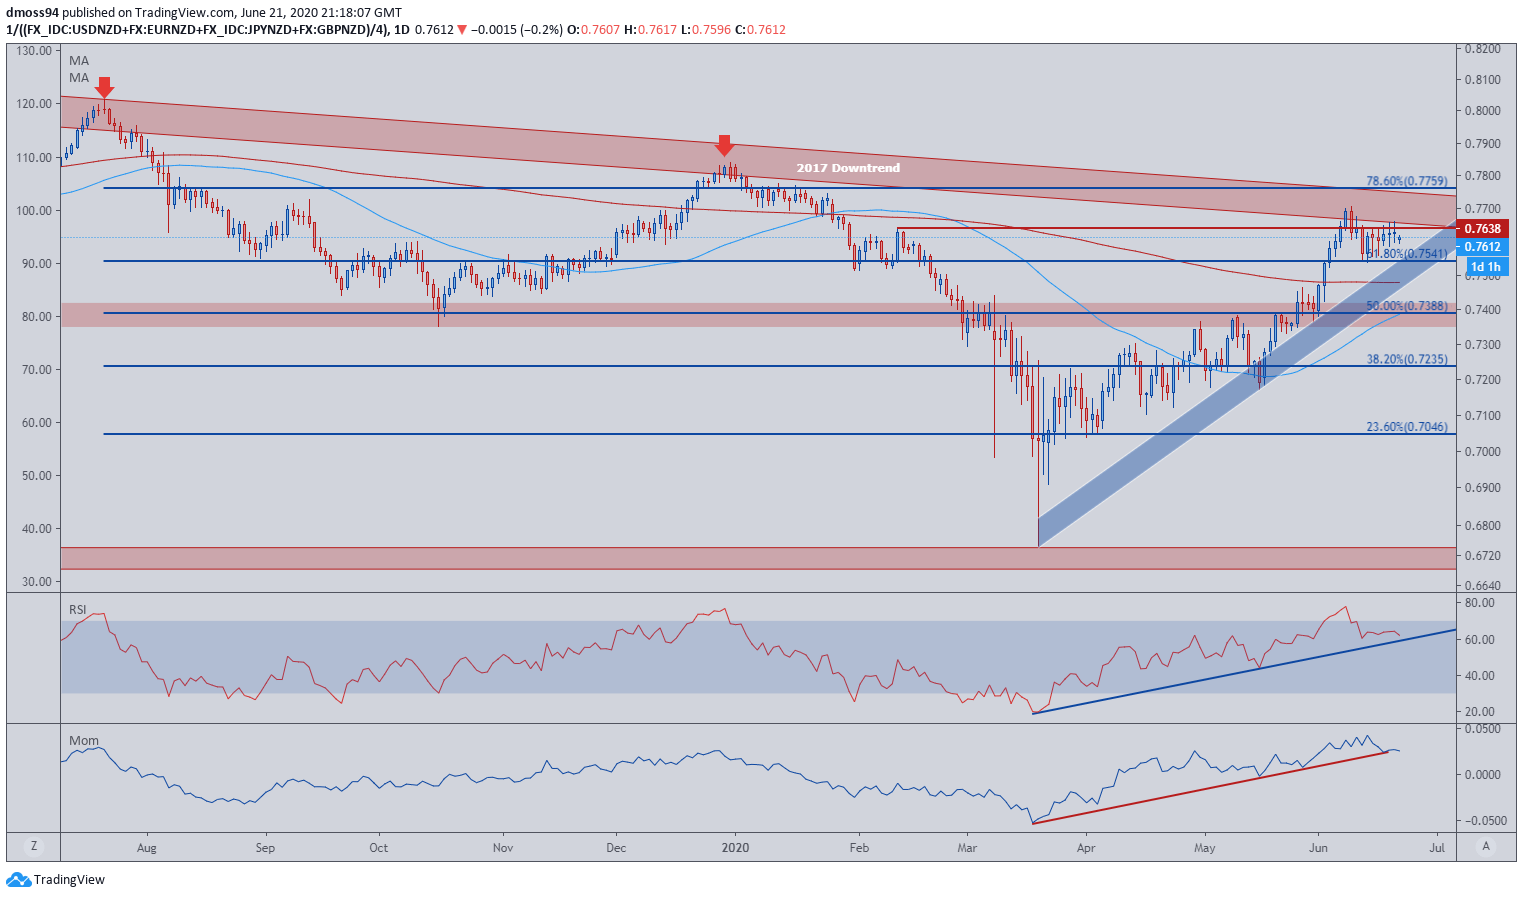
NZD Index chart created using TradingView
The New Zealand Dollar’s surge from the March lows may be running out of steam as price fails at a familiar inflection point that has successfully contained buying pressure since January 2017.
Despite the RSI pushing into overbought territory for the first time this year, the break above the February high (0.7638) proved to be short lived for the risk-sensitive currency as price retreated to support at the 61.8% Fibonacci (0.7541).
With the 2017 downtrend proving formidable for NZD bulls, price may continue its slide back to the uptrend from the March low (0.6740) with the 200-day moving average (0.7480) possibly acting as the line in the sand for would-be buyers.
Bearish bias may intensify as the RSI and momentum oscillators fall back to their respective 14-week uptrends, with a break and close below the 200-MA (0.7480) and trend support possibly signalling a resumption of the New Zealand Dollar’s depreciation against its major counterparts.
NZD/CAD Daily Chart – ‘Adam and Eve’ Double Top Signal Impending Reversal?
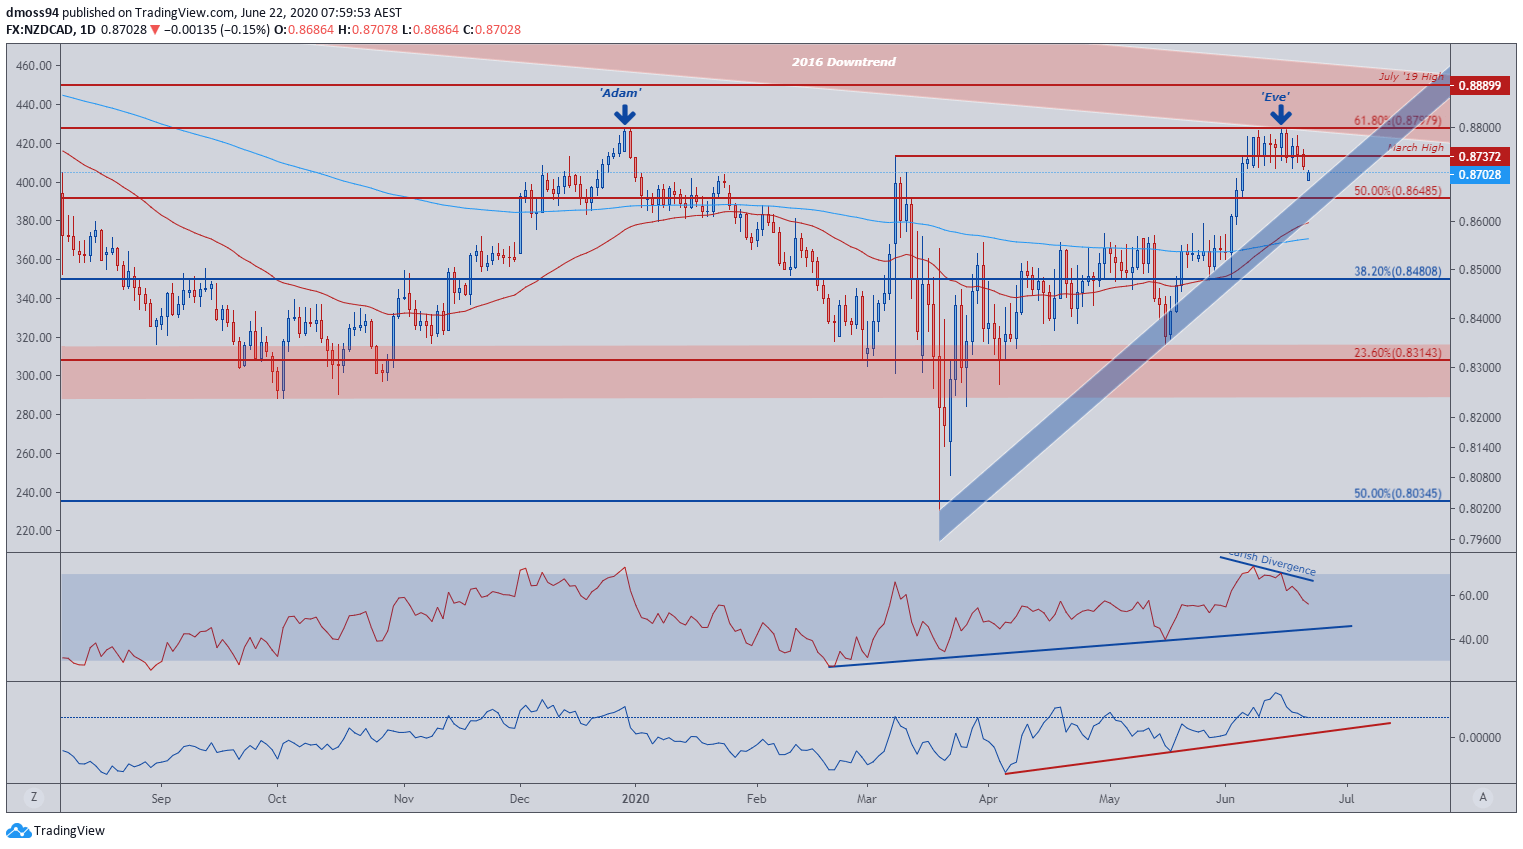
NZD/CAD chart created using TradingView
The psychologically imposing 0.88-handle could prove to be a step too far for NZD/CAD, as the formation of price action appears to be suggestive of a potential ‘Adam & Eve’ Double Top at the 61.8% Fibonacci (0.8798).
The name ‘Adam & Eve’ referring to the reaction of price at the potential reversal level, with a short-aggressive test of resistance (Adam) followed by a rounded, more sustained development of price on the second re-test (Eve).
Divergence on the RSI reinforces the bearish dynamic displayed through price and could see NZD continue to lose ground against its Canadian counterpart, with support at the convergence of the 50% Fibonacci (0.8648) and 3-month uptrend pivotal in deciding the future direction of the exchange rate.
A break and close below the 50% Fibonacci (0.8648) may intensify selling pressure, with a close below the 200-MA (0.8565) carving a path for price to push back to the May low and 23.6% Fibonacci (0.8314)

NZD/JPY Daily Chart – 61.8 % Fibonacci Support Last Line of Defence
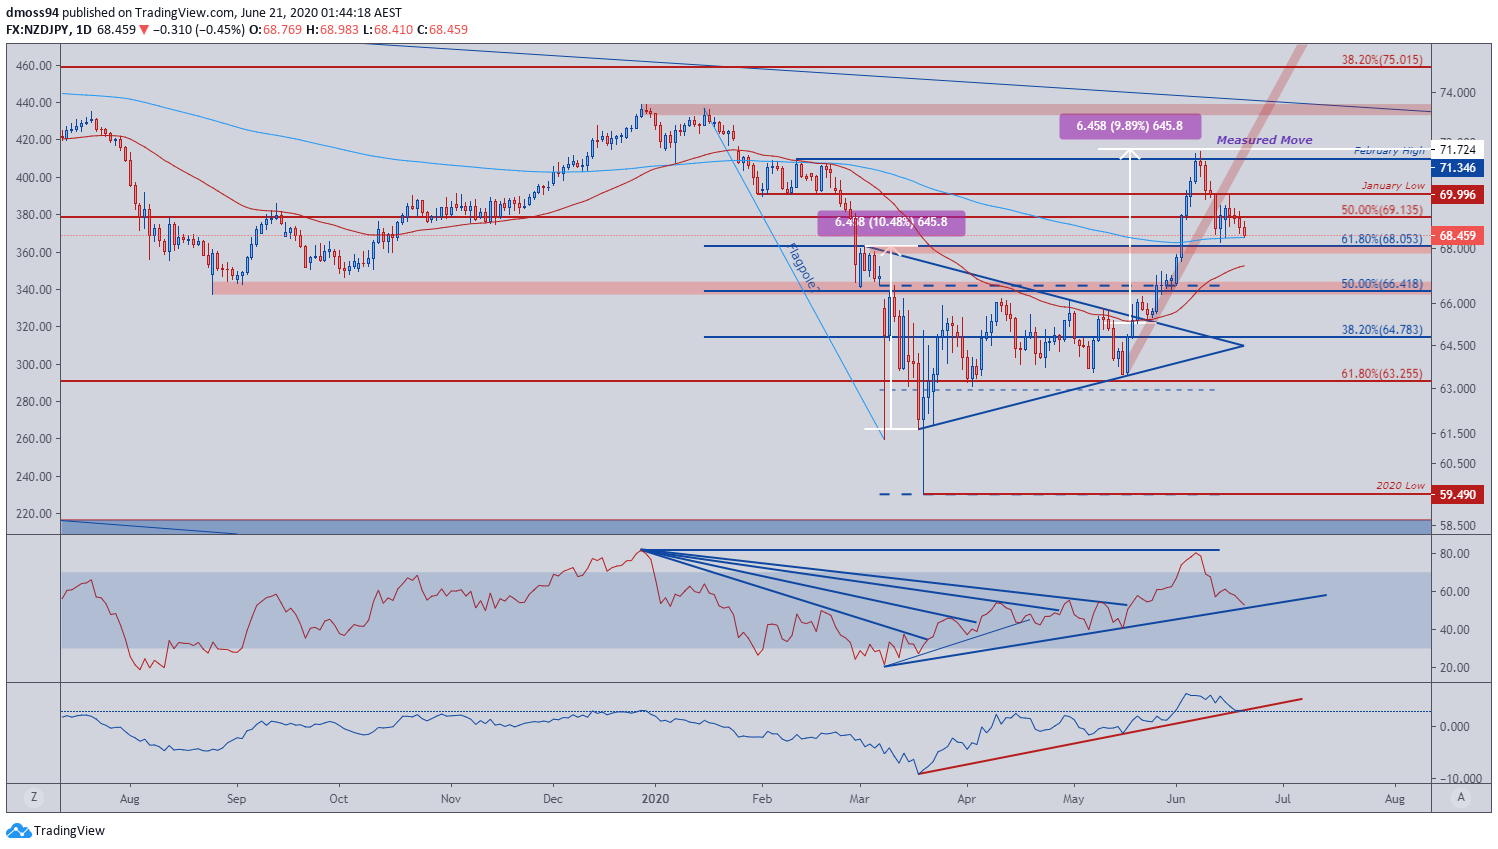
NZD/JPY chart created using TradingView
Slicing through 4-week trend support on June 11, NZD/JPY may be poised for further downside as the RSI and momentum indicators begin to snap their respective 3-month uptrends.
Support at the 200-MA (68.40) and 61.8% Fibonacci (68.05) may provide a base for price to potentially rally back to test the January low (69.99) however the development of price action suggests this is unlikely.
A convincing close below the 61.8% Fibonacci (68.05) and 50-MA (67.40) could lead to a resumption of the primary downtrend and see price possibly fall back to the April high (66.16) with the May low (63.46) the next key region of interest should NZD/JPY clear support at the psychological imposing 65-handle.
NZD/CHF Daily Chart – Ascending Channel Contains Price…. For Now

NZD/CHF chart created using TradingView
Confined within an ascending channel since setting a fresh 11-year low in March (0.5299) NZD/CHF may be poised for a break to the downside, as the RSI snaps its uptrend from the yearly lows and the momentum indicator fails to follow price to higher highs.
The convergence of the 38.2% Fibonacci (0.6068) and channel support may provide a base for price to continue to grind higher, with a close back above the 200-MA (0.6144) possibly opening a path back to the monthly high (0.6298).
However, a break of channel support and close below the 38.2% Fibonacci (0.6068) and 50-MA (0.6014) may signal further depreciation in NZD and a continuation of the long-term downtrend, with a re-visit of the yearly low (0.5795) a real possibility should price clear support at the May low (0.5750)
-- Written by Daniel Moss
Follow me on Twitter @DanielGMoss


