


GBP/USD, GBP/AUD and FTSE 100 – Prices, Charts and Analysis:
- Bank of England likely to increase QE by GBP100 billion on Thursday.
- GBP/USD and FTSE 100 may struggle to move higher.

A busy week for UK asset traders with important data and key events the likely drivers of any move. In addition, the markets remain in risk-off mode as fears of a second wave of COVID-19 weigh on Sterling and the FTSE 100.
British Pound (GBP) Latest: GBP/USD Facing a Storm of Risk Events
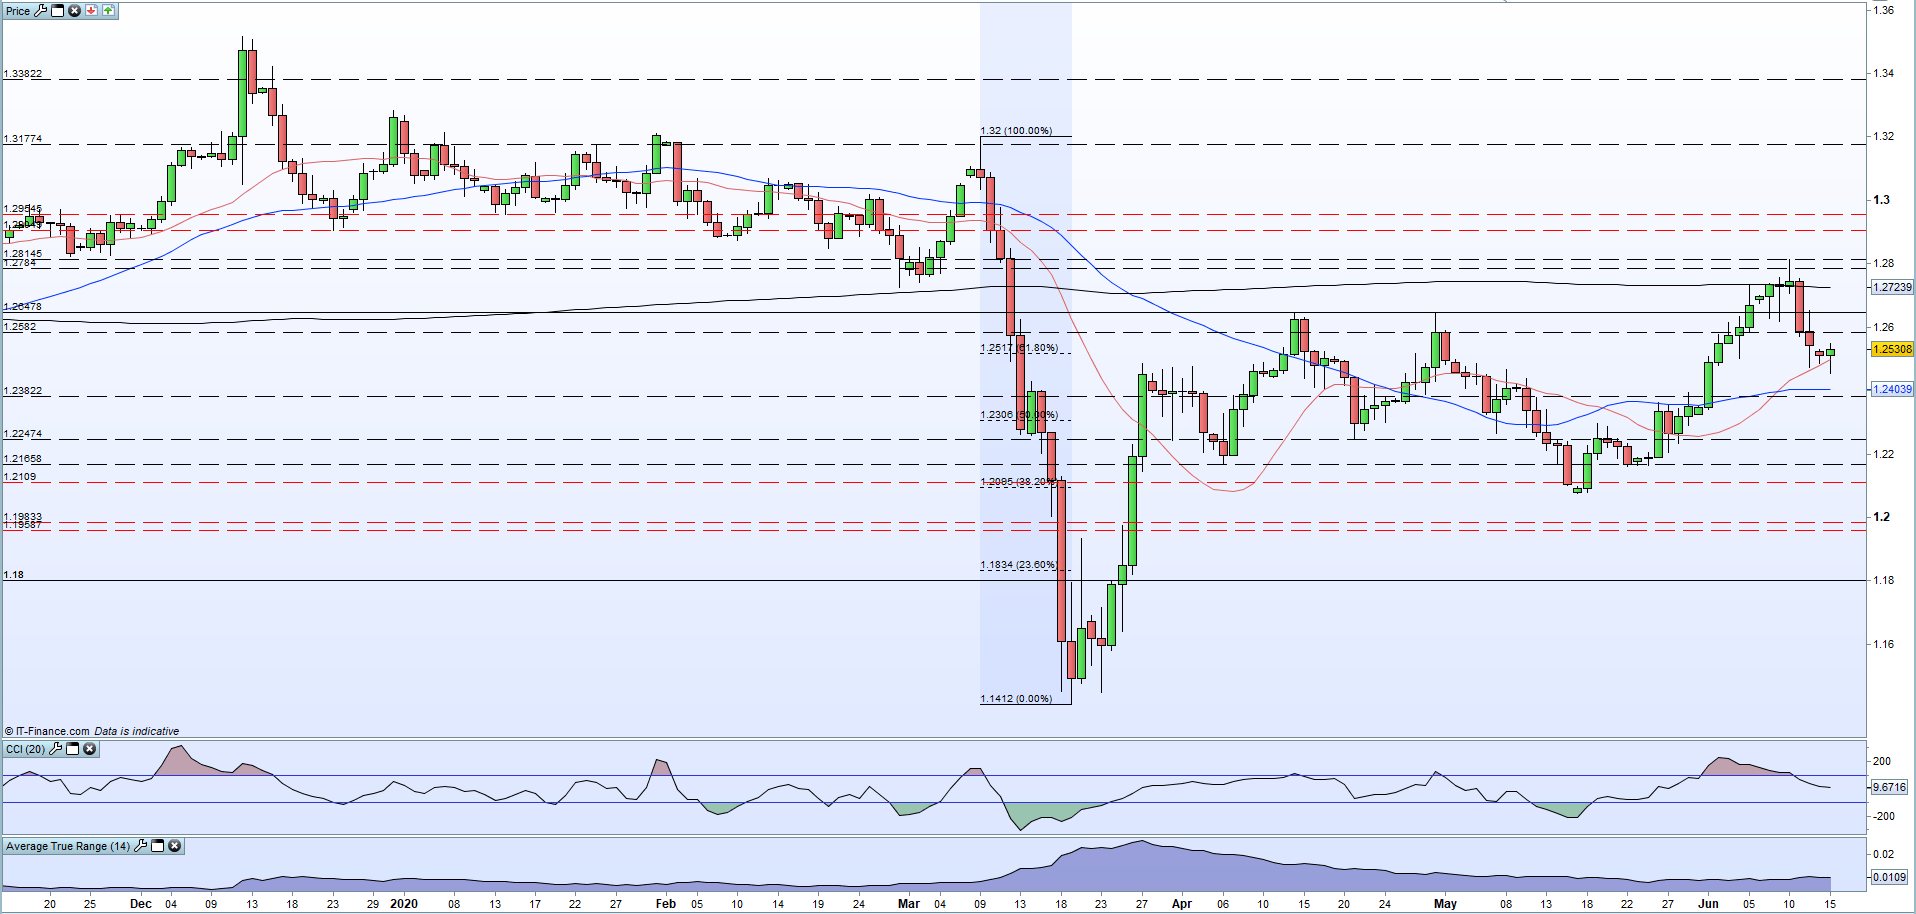
GBP/USD may test the 50-day moving average at 1.2404 as the pair continue their short-term sequence of lower highs and lower lows. The 61.8% Fibonacci retracement level at 1.2517 is worth watching to see if it turns into resistance or support. Macro events will likely drive the next move.
GBP/USD Daily Price Chart (December 2019 – June 15, 2020)
| Change in | Longs | Shorts | OI |
| Daily | 3% | -7% | -3% |
| Weekly | 4% | -10% | -5% |
GBP/AUD continues to edge higher after the 1.8050 area held for three consecutive days. The risk-on Australian dollar is sliding lower and GBP/AUD may seek to press higher towards the 1.8650 area.
GBP/AUD Daily Price Chart (December 2019 – June 15, 2020)

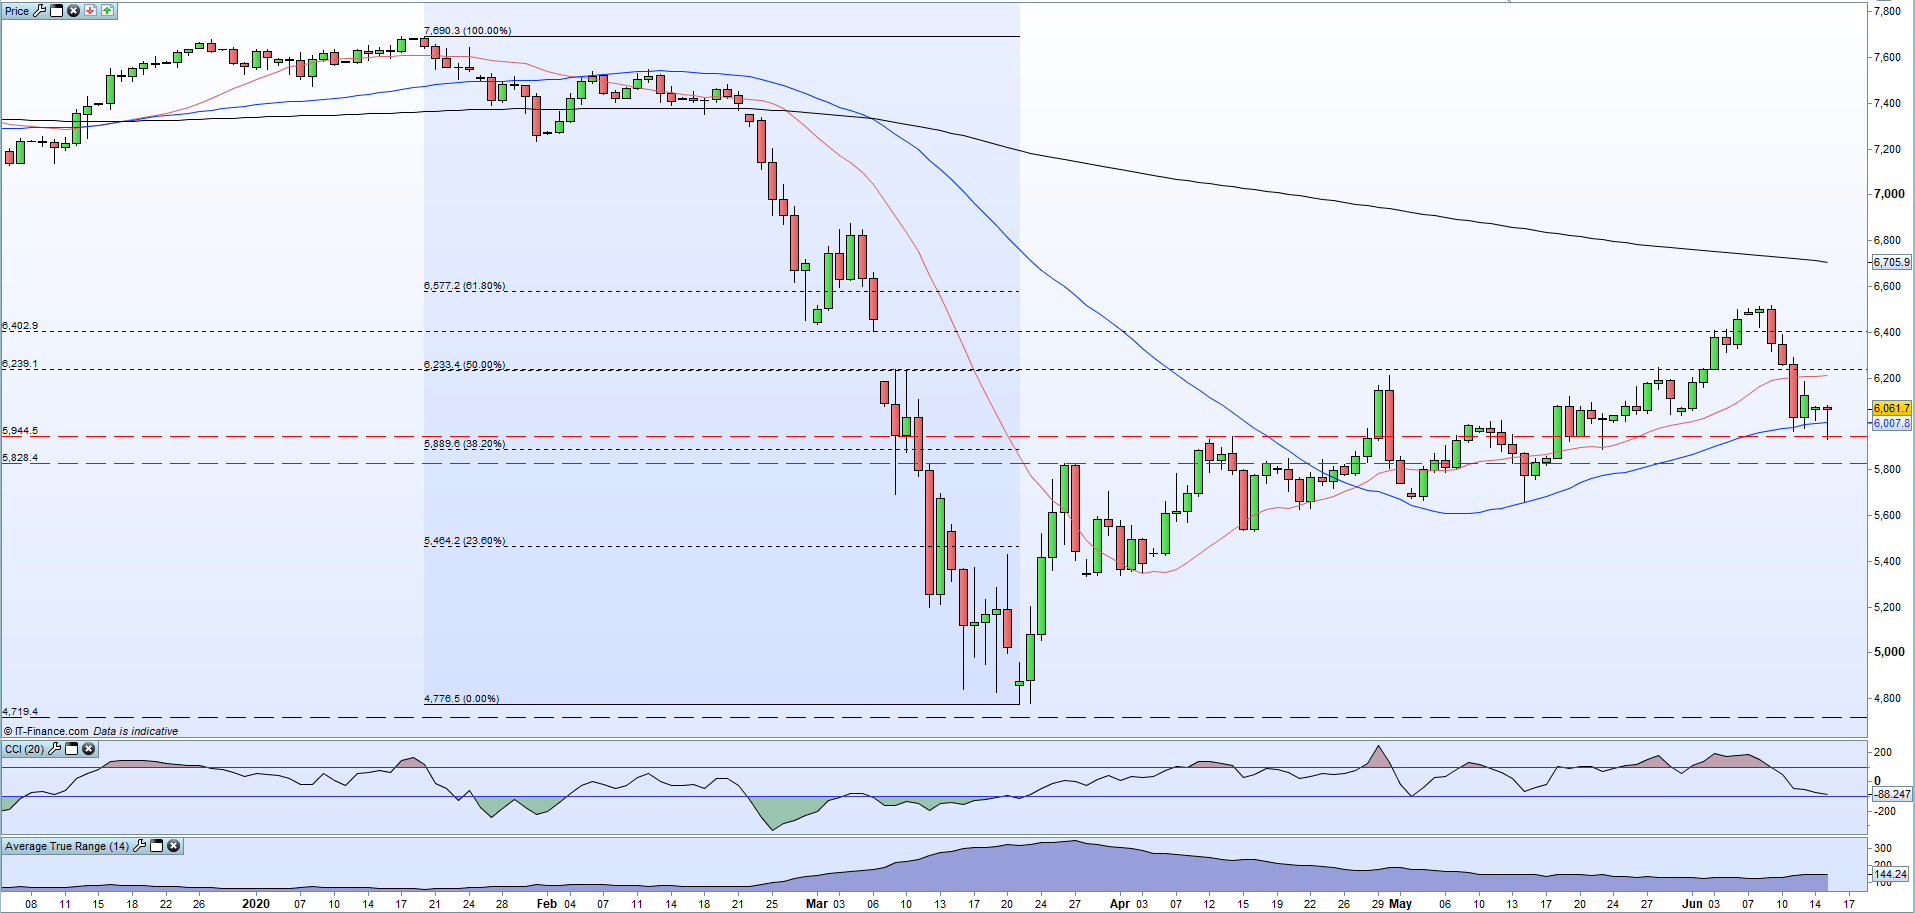
The FTSE 100 continues to probe support off the 50-day moving average and a close and open below 6,008 may see the 38.2% Fibonacci retracement level at 5,889 come into play in short order. The upside looks capped between the 20-dma at 6,210 and the 50% Fib retracement at 6,233.
FTSE 100 Daily Price Chart (December 2019 – June 15, 2020)
Traders of all levels and abilities will find something to help them make more informed decisions in the new and improved DailyFX Trading Education Centre
What is your view on Sterling (GBP) and the FTSE 100 – bullish or bearish?? You can let us know via the form at the end of this piece or you can contact the author via Twitter @nickcawley1.


