


British Pound (GBP) – EU/UK Talks and GBP/USD Forecast, Chart and Analysis:
- UK unemployment, inflation and retail sales data on the docket this.
- EU/UK trade talks ramp up.
- Fed chair Jerome Powell testifies to Congress on Tuesday and Wednesday.

GBP/USD Looking at a Volatile Week Ahead
A busy week for Sterling traders with GBP already under downside pressure as markets continue to shun risk. GBP/USD is trading around 330 pips lower after touching 1.2816 last Wednesday, while EUR/GBP is back above 0.9000 and eyeing a multi-week high at 0.9055.
- Monday – High level EU/UK trade talks between UK PM Boris Johnson and EU Commission President Ursula von der Leyen.
- Tuesday – UK unemployment and wages data (April) released at 07:00 UK.
- Tuesday – Fed chair Jerome Powell testifies to Congress from 15:00 UK.
- Wednesday – UK inflation data (May) released at 07:00 UK.
- Thursday – Bank of England monetary policy announcement and minutes at 12:00 UK.
- Friday – UK retail sales (May) released at 07:00 UK.
All of the above events have the ability to stoke up volatility in GBP/USD and EUR/GBP with today’s EU/UK talks becoming increasingly important. UK PM Johnson is expected to try and push the EU harder to compromise on the single block’s red lines with the UK already stating that there will be no extension to the transition period. Fed chair Powell’s speech on Tuesday will be parsed for further clues on the health of the US economy, while Thursday’s BoE meeting is likely to see the central bank increase the current QE program by another GBP100 billion. Talk of negative UK interest rates seems premature but cannot be fully ruled out.
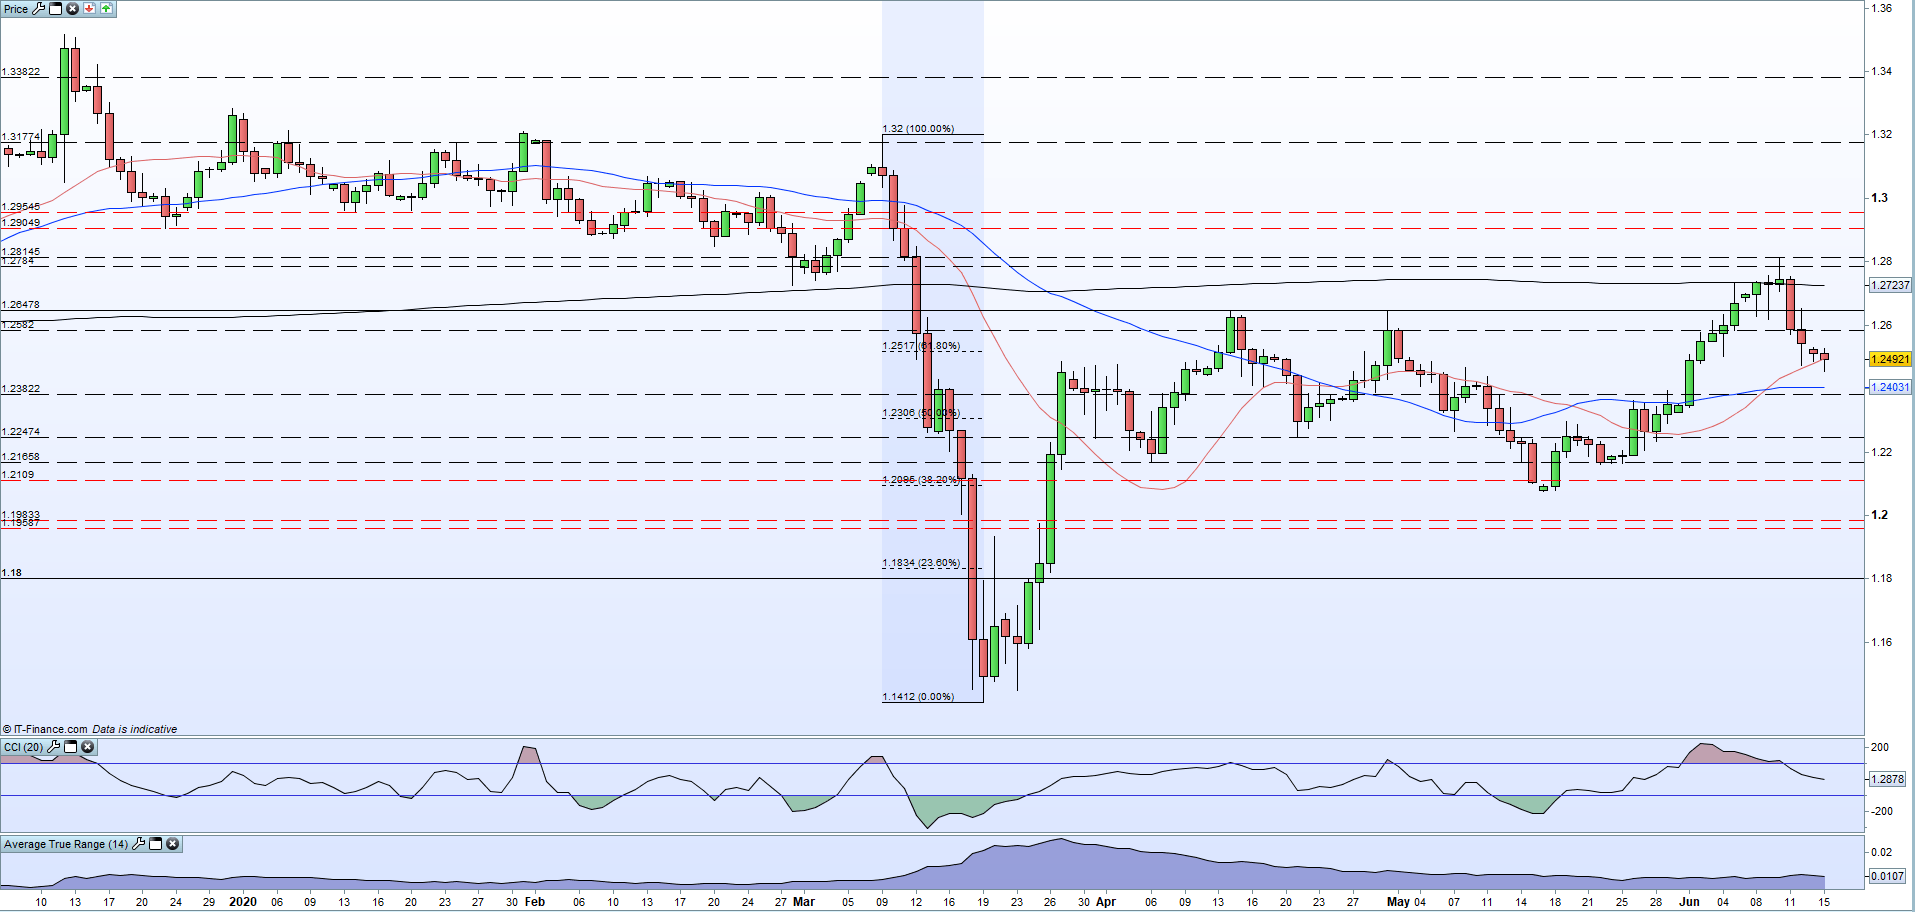
GBP/USD continues to print a short-term series of lower highs and lower lows and is back below the 61.8% Fibonacci retracement level at 1.2517. The pair broke the 200-dma last week and currently trade either side of the 20-dma around 1.2492. The 50-dma may provide first line support at 1.2403 ahead of the 50% Fib at 1.2306. To the upside, resistance between 1.2648 and 1.2652.
GBP/USD Daily Price Chart (December 2019 – June 15, 2020)
| Change in | Longs | Shorts | OI |
| Daily | 3% | -7% | -3% |
| Weekly | 4% | -10% | -5% |
Traders may be interested in two of our trading guides – Traits of Successful Traders and Top Trading Lessons – while technical analysts are likely to be interested in our latest Elliott Wave Guide.
What is your view on Sterling (GBP) – bullish or bearish?? You can let us know via the form at the end of this piece or you can contact the author via Twitter @nickcawley1.


