


Gold Price (XAU/USD) and Silver Price (XAG/USD) Analysis, Prices and Charts

Gold On The Rise as the US Dollar Sell-Off Continues.
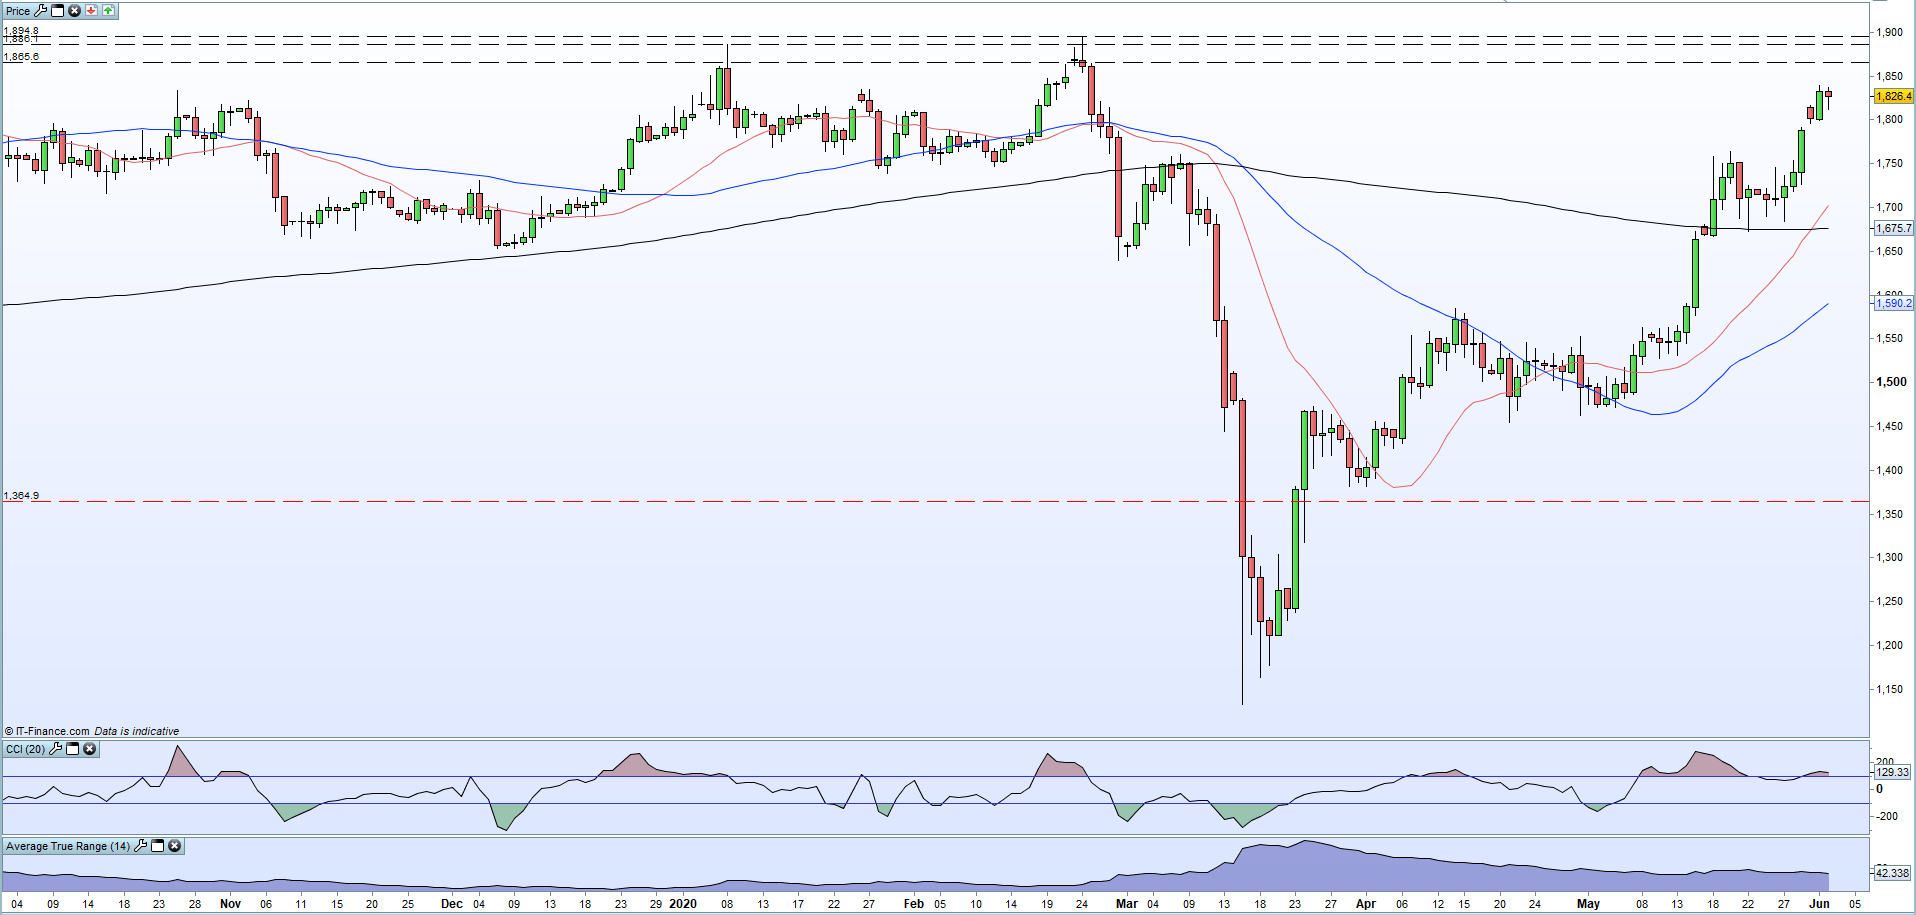
Gold currently trades around $1,740/oz. and looks set to push higher if the sell-off in the US dollar continues. After breaking out of a pennant formation on May 13 around $1,703/oz. the precious metal made a fresh multi-year high at $1,765.5/oz. and this level may be challenged in the short-term as goldcontinues to respect support off the early-April low. A series of lower highs highlight the positive sentiment in the precious metal, and while the US dollar sell-off persists the chances of a fresh high remain in place. The current risk-on sentiment seen across the market is weighing on this move higher and may stiffle further upside, so political risks should be closely followed. A break and close above $1,765.5/oz. leaves the October 2012 high at $1,795/oz. as the next target. Support from the 20-dma at $1,729/oz. and trend around $1,719/oz.
Gold Daily Price Chart (November 2019 – June 2, 2020)


Silver Pauses as Rebound Nears Completion
Silver is seemingly on-track to re-coup all of its Febraury 24/March 16 losses as the semi-precious metal prints a series of higher lows and higher highs. The break back above the 200-dma on May 18 confirmed silver’s positive longer-term outlook while the 20-dma broke above the 200-dma at the start of the week, adding another positive impulse. Silver needs to trade above yesterday’s high at $18.38 to keep the recent series of higher highs and allow an eventual re-test of $18.95. Initial support from this week’s low just under $18.00 ahead of a series of recent old highs either side of $17.50.
Silver Daily Price Chart (October 2019 – June 2, 2020)
What is your view on Gold and Silver – are you bullish or bearish?? You can let us know via the form at the end of this piece or you can contact the author via Twitter @nickcawley1.


