

Technical Outlook:
- US Dollar Index (DXY) trying to break range, Euro driving
- Gold price has a near-term bullish set-up it is trying to trigger
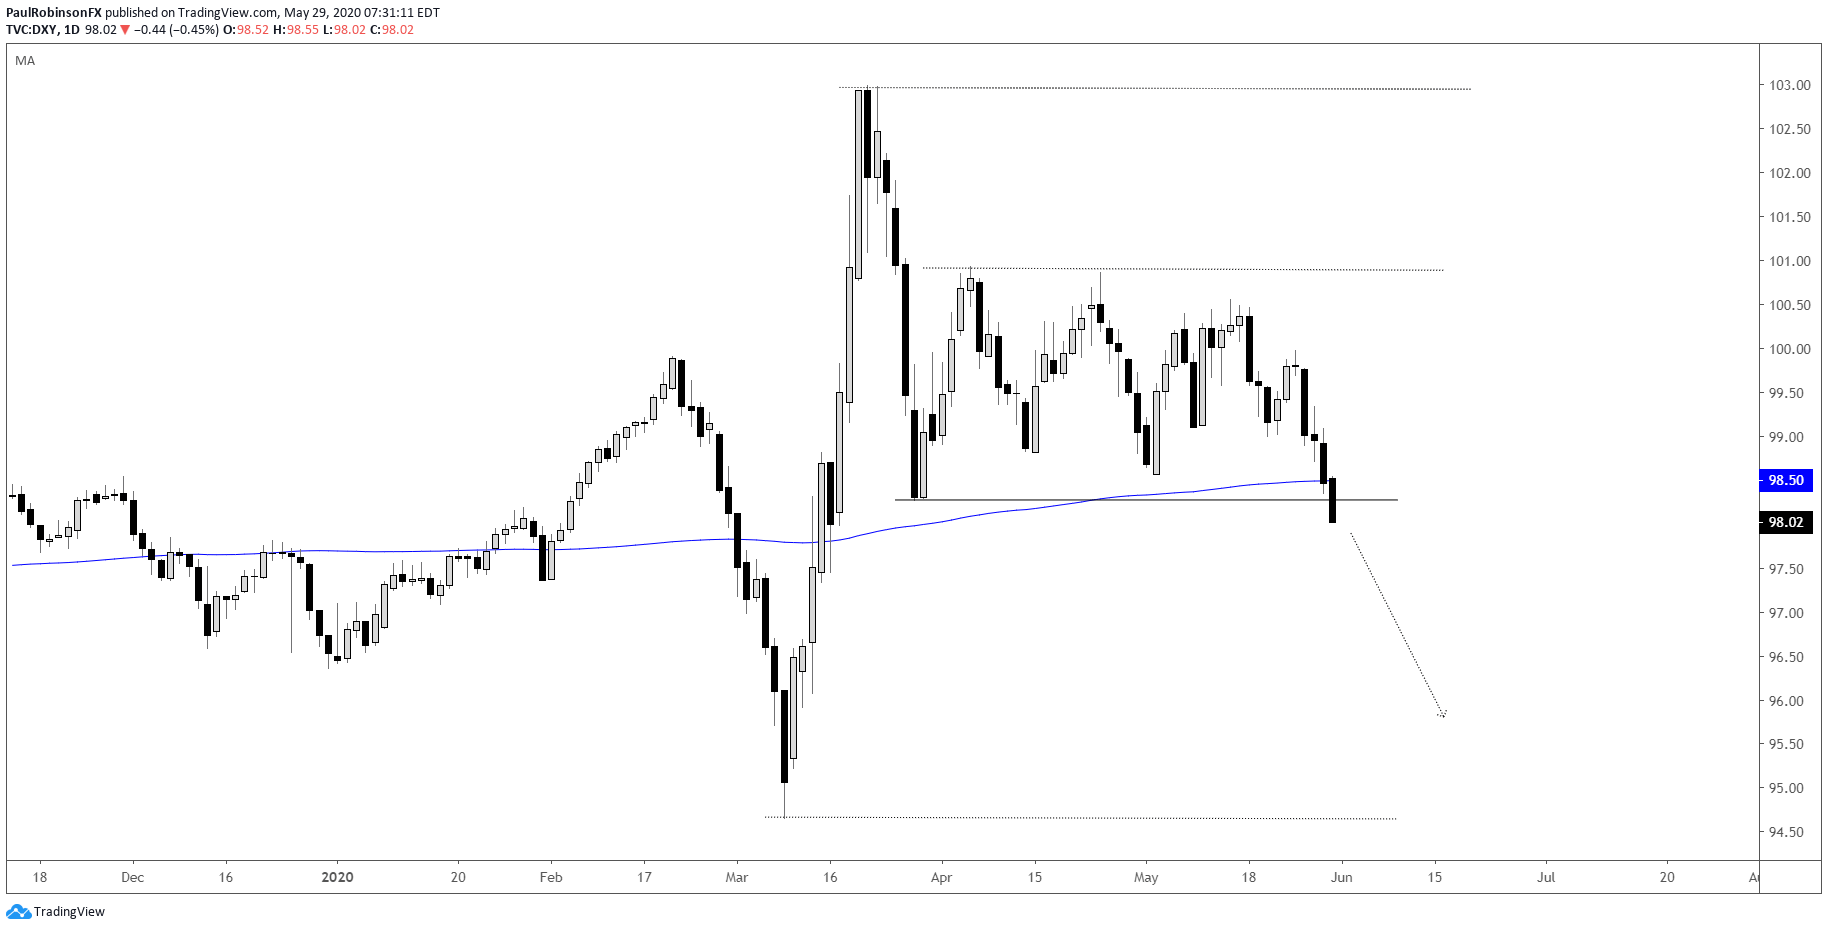
The US Dollar Index (DXY) is on the verge of confirming the breakdown of a nearly two-month range. The trading has been brutal for those looking for trend set-ups, but that could be about to change should we see a daily close below 98.27. As the new week begins it will be important to monitor this situation; sustained trade below could have the index quickly moving down 2-4%.

US Dollar Index (DXY) Daily Chart (range will eventually break)
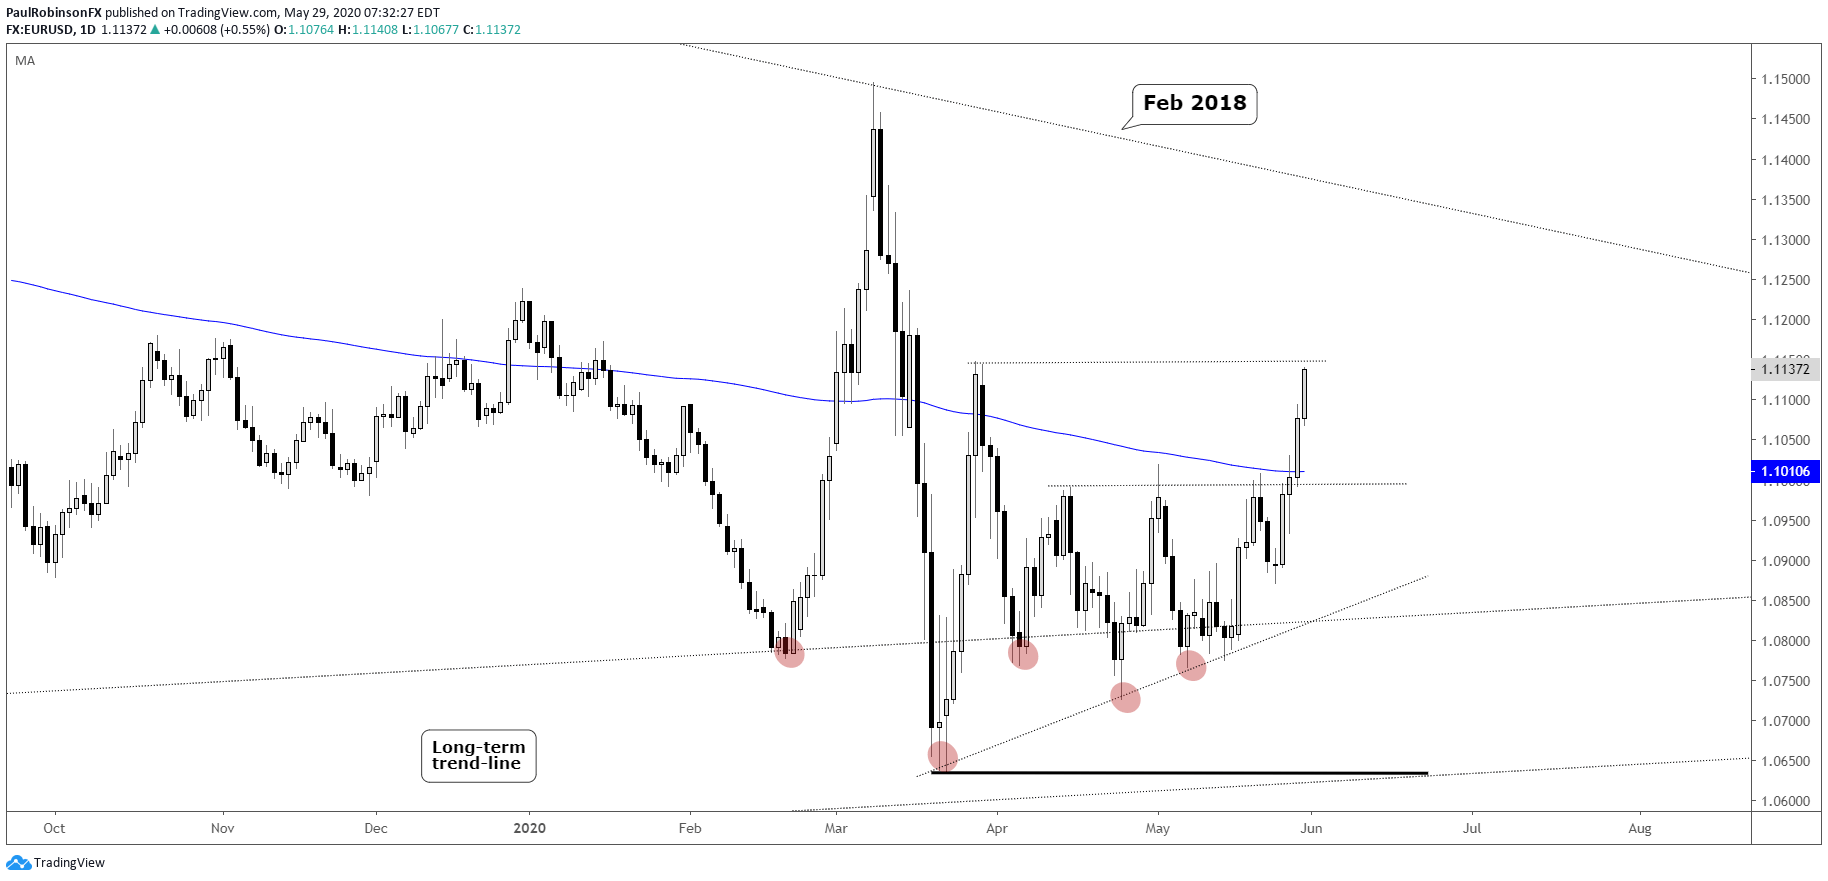
The Euro is the big driver here for DXY as it is 57% of the index. It is rising now and trying to break above the March 27 high at 11147. It is difficult to trust a EUR/USD rally these days since it has not held onto one for very long since topping back in early 2018. Should it hang onto recent gains without immediately retrenching and the DXY stays below the range, then we may be on to a larger move.
EUR/USD Daily Chart (trying to prove itself with rally)
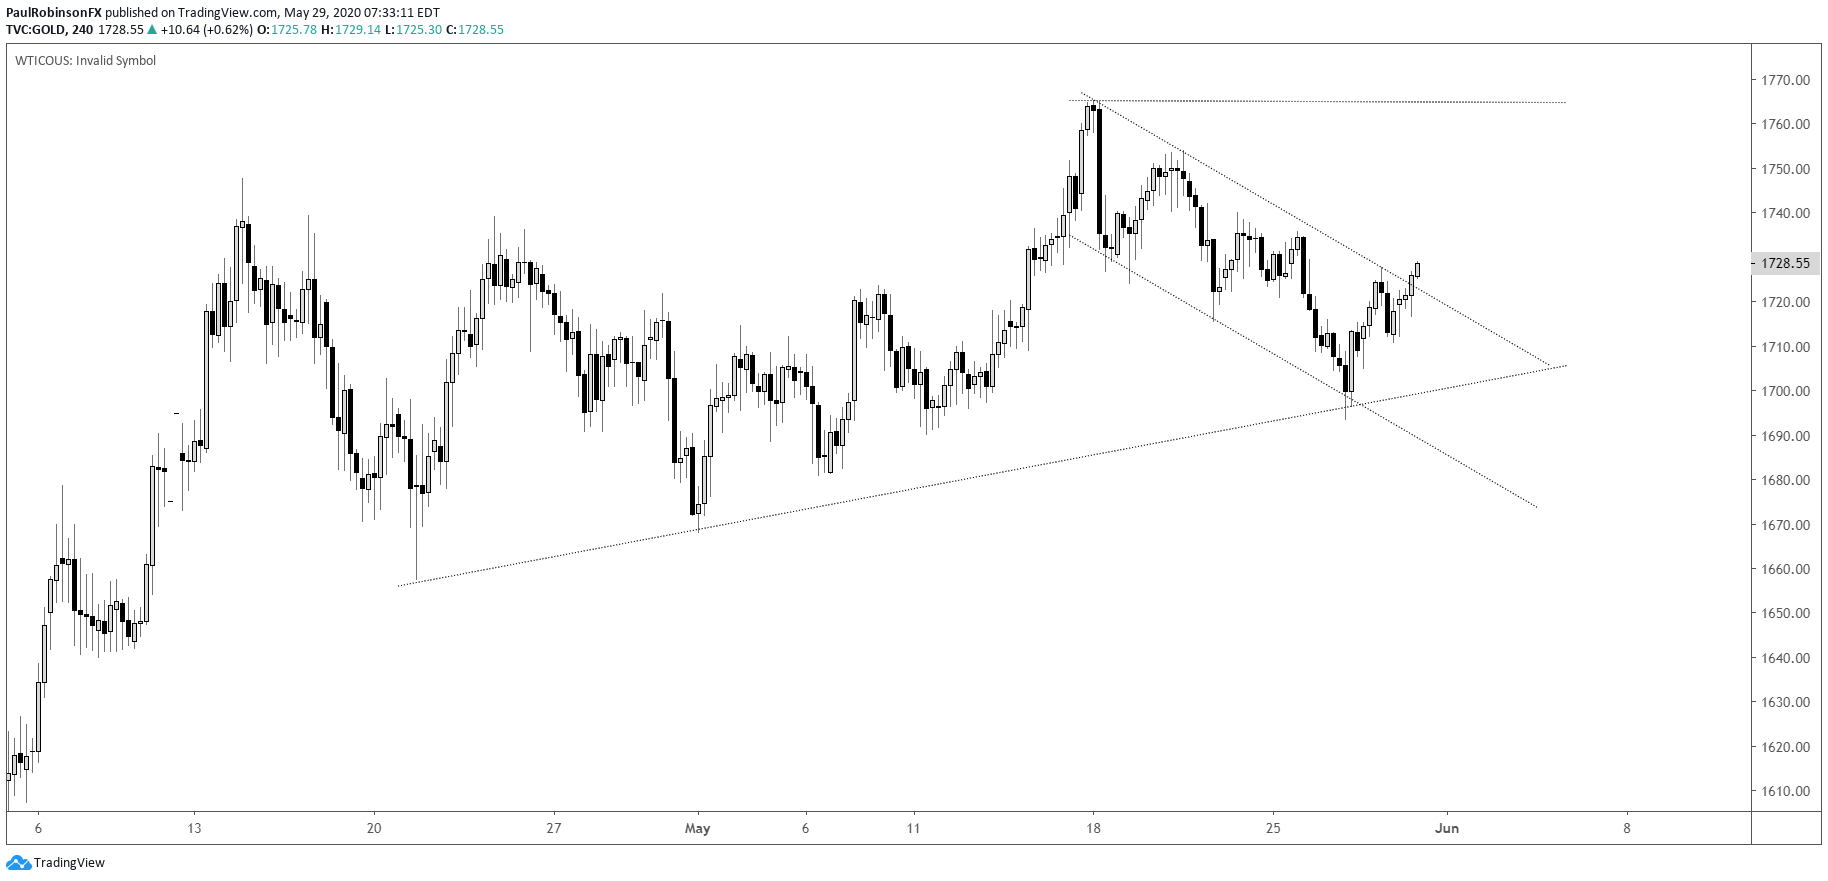
Gold has a short-term bullish set-up that may play nicely with USD weakening. The longer and shorter-term path of least resistance remains higher. There is a choppy declining channel (bull-flag-like) that gold is trying to pop out of. A full push out of the pattern could have the high at 1765 in play, and should it break that then it may be on towards the big long-term levels from 2011/12 around 1800.
Gold 4-hr Chart (trying for a breakout)
Gold Price Chart by TradingView
For all the charts we looked at, check out the video above…
Resources for Forex Traders
Whether you are a new or an experienced trader, DailyFX has several resources available to help you; indicator for tracking trader sentiment, quarterly trading forecasts, analytical and educational webinars held daily, and trading guides to help you improve trading performance.
---Written by Paul Robinson, Market Analyst
You can follow Paul on Twitter at @PaulRobinsonFX