


Gold Price News, Charts and Analysis:
- Multi-decade low oil prices highlight economic risks ahead.
- Gold trying to respect short-term support.

Gold’s Haven Status Under Question as Markets Shun Risk
The historic collapse of the oil market saw the May front-month US crude contract trade around -$37/bbl. yesterday at one stage with oil storage facilities running out of space. With the May contract expiring today, sellers have now turned on the June crude which has already traded between $12/bbl. and $22.8/bbl. and is currently down nearly 18% at $16.80/bbl. While the global economy continues its sharp contraction, volatility in oil will continue.
US Crude Oil Collapses to Negative -$37 per Barrel – Why and What Does it Mean?
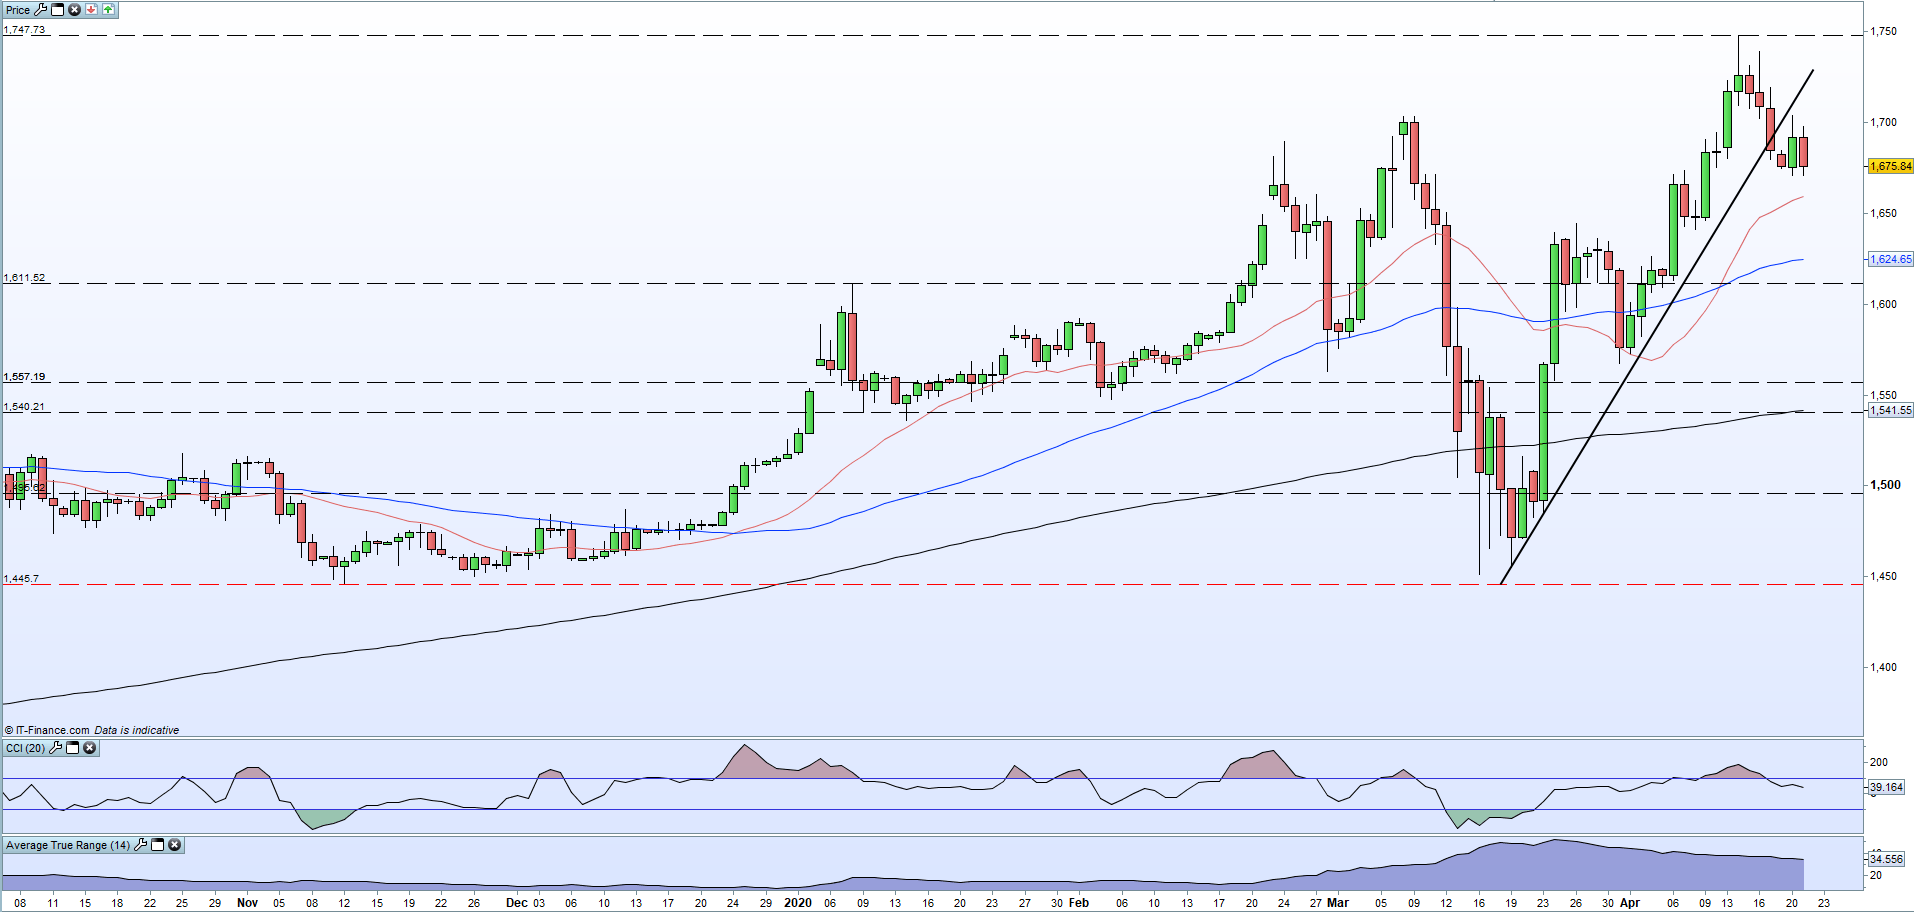
In normal times, and these are anything but normal times, gold would be boosted by haven buying alongside side other risk averse assets including the US dollar, the Japanese Yen and the Swiss Franc. However gold is struggling and has fallen back from its recent multi-year high of $1,747/oz. The supportive trend off the March 16 low has now been broken and is acting as resistance, despite the market tone. The precious metal found support from Monday’s $1,671/oz. low print earlier today and if this level is broken today it will continue the pattern of lower lows and highs – excluding the Sunday candle – started last week. The next area of support comes in around $1,640 - $1,645/oz.
If gold shakes off the market’s current dash for liquidity, then a print above $1,704/oz. will break the series of lower highs and open the way to a potential move back to $1,720/oz. The markets remain extremely volatile, making this traditional haven asset difficult to trade.
How to Trade Gold: Top Gold Trading Strategies and Tips
Gold Daily Price Chart (October 2019 – April 21, 2020)

What is your view on Gold – are you bullish or bearish?? You can let us know via the form at the end of this piece or you can contact the author via Twitter @nickcawley1.


