


Technical Outlook:
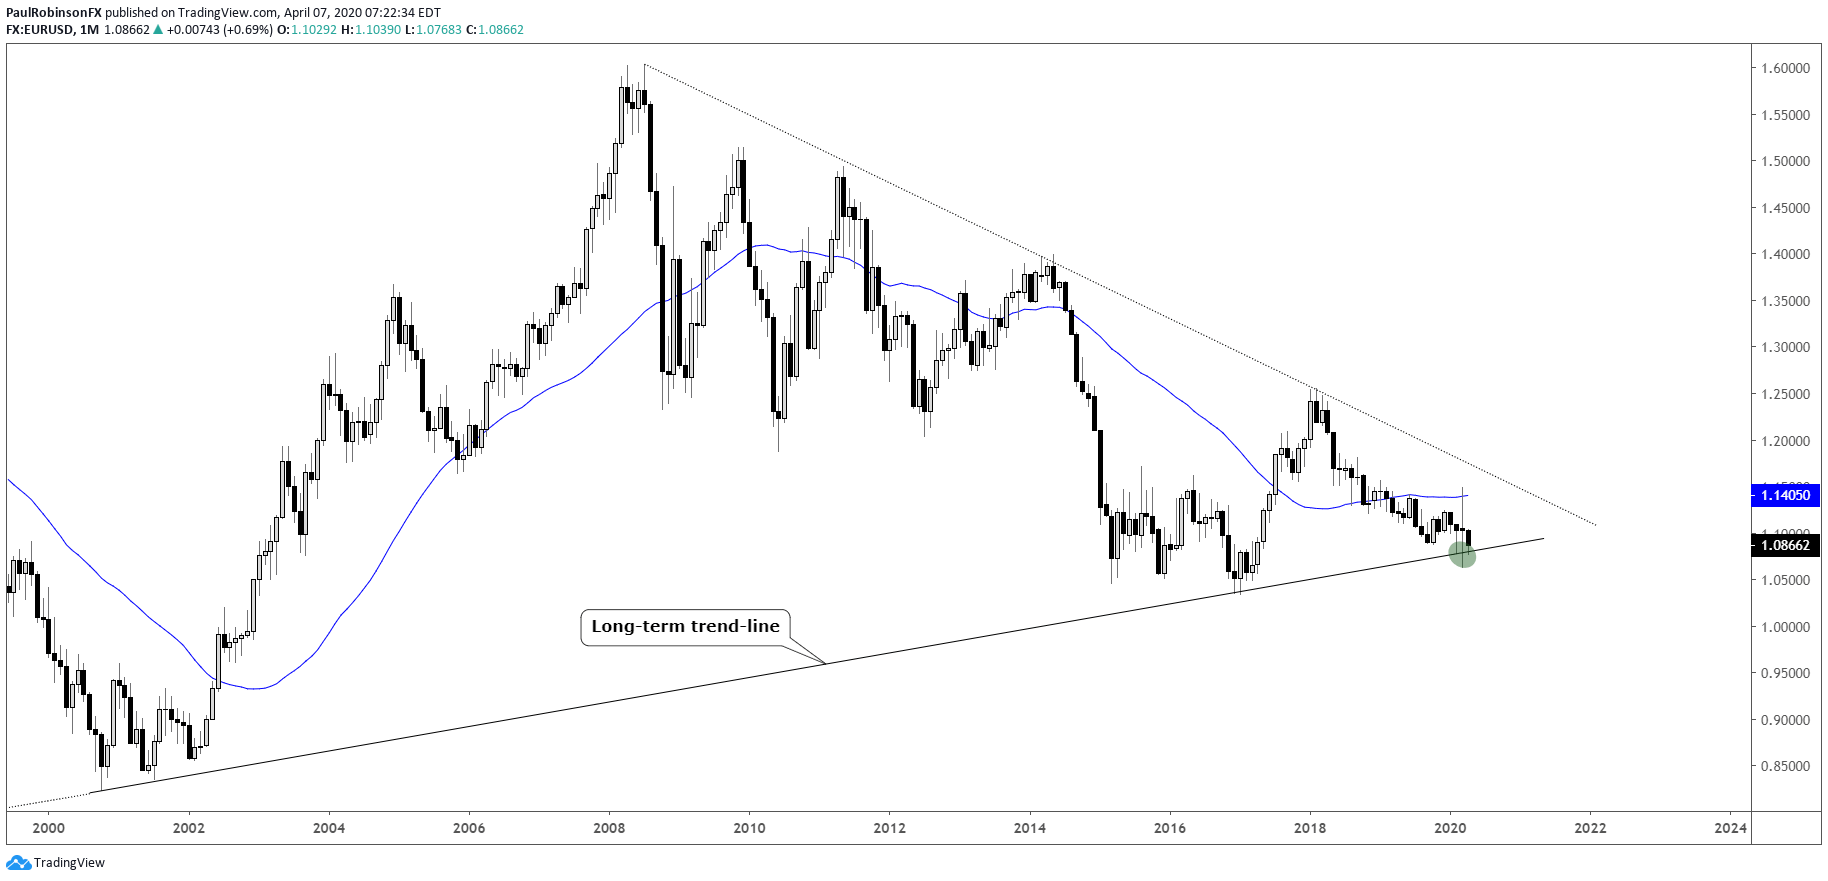
EUR/USD is trading around a major long-term threshold, one that I’ve been discussing a lot lately because of not only its importance, but the price action behavior we are seeing. In February the Euro popped hard off of the line, but then has been tested again twice since. The repeated testing hints at it weakening and increases the likelihood that the trend-line dating back to 2000 (and before if reconstructing price from the Euro constituents).
The trend-line is support until it isn’t. A break below 10636 will likely have EUR/USD rolling lower towards lower levels. The 2017 low at 10340 and parity would likely be at risk soon after any kind of break develops. In the event the Euro wants to build a base, it will take some time for the upside to gain traction with the general tilt of the chart pointed decisively lower.
EUR/USD Monthly Chart (thoroughly testing long-term support)
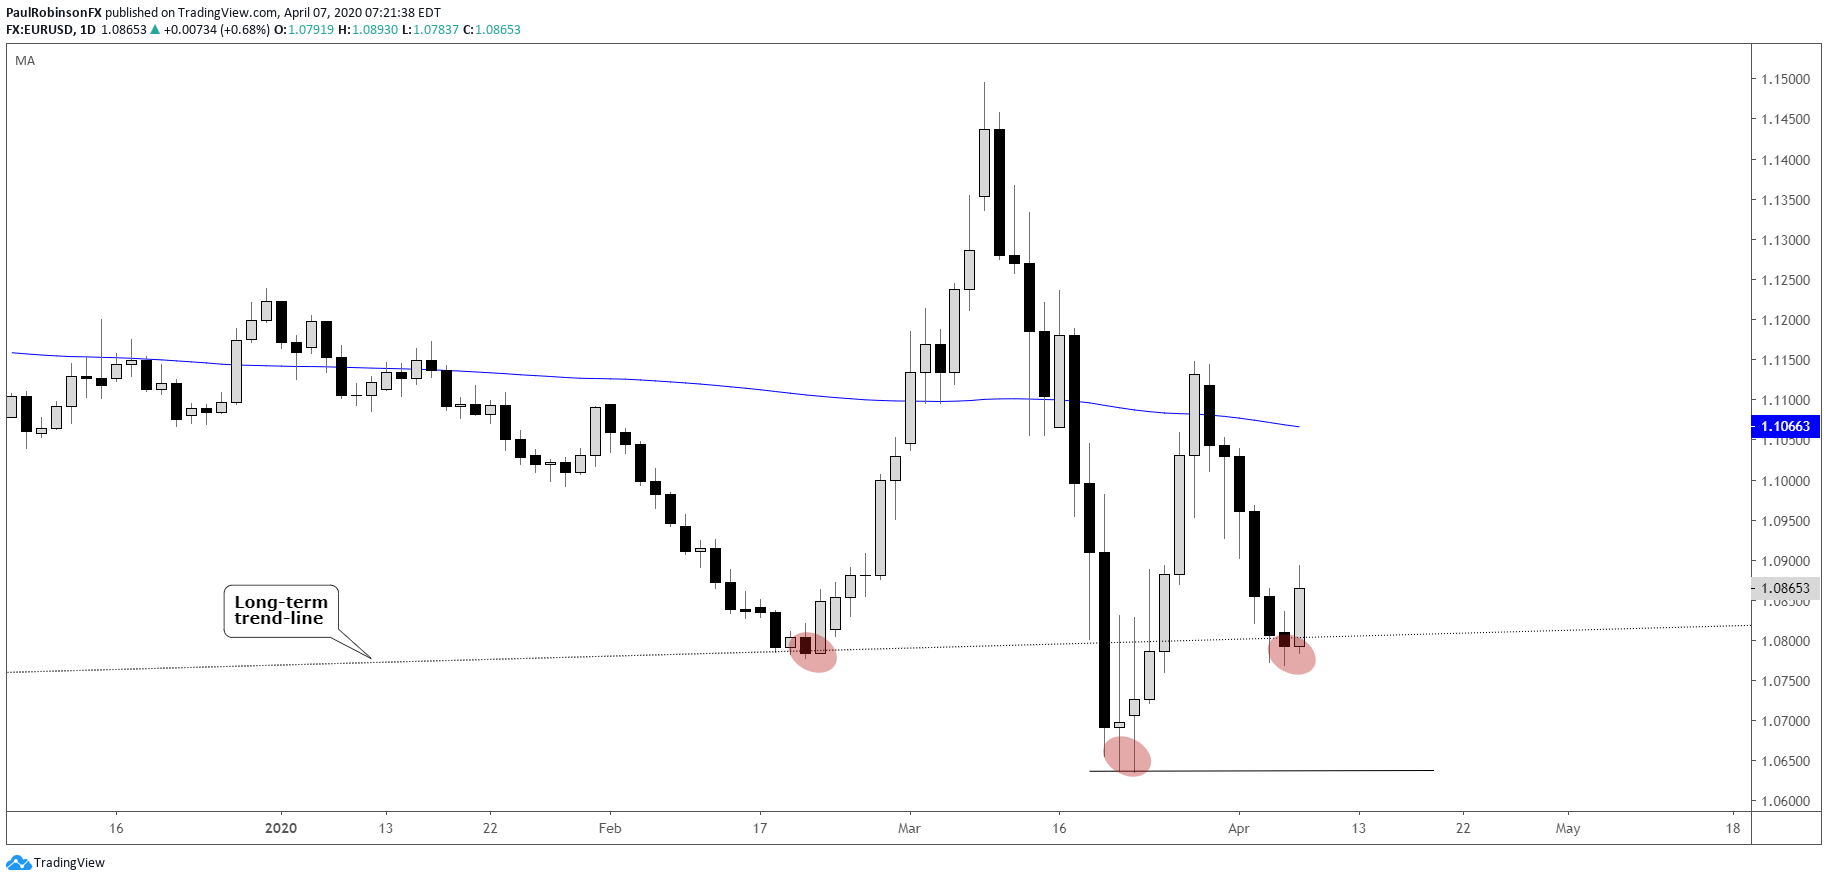
EUR/USD daily chart (appears to be weakening)
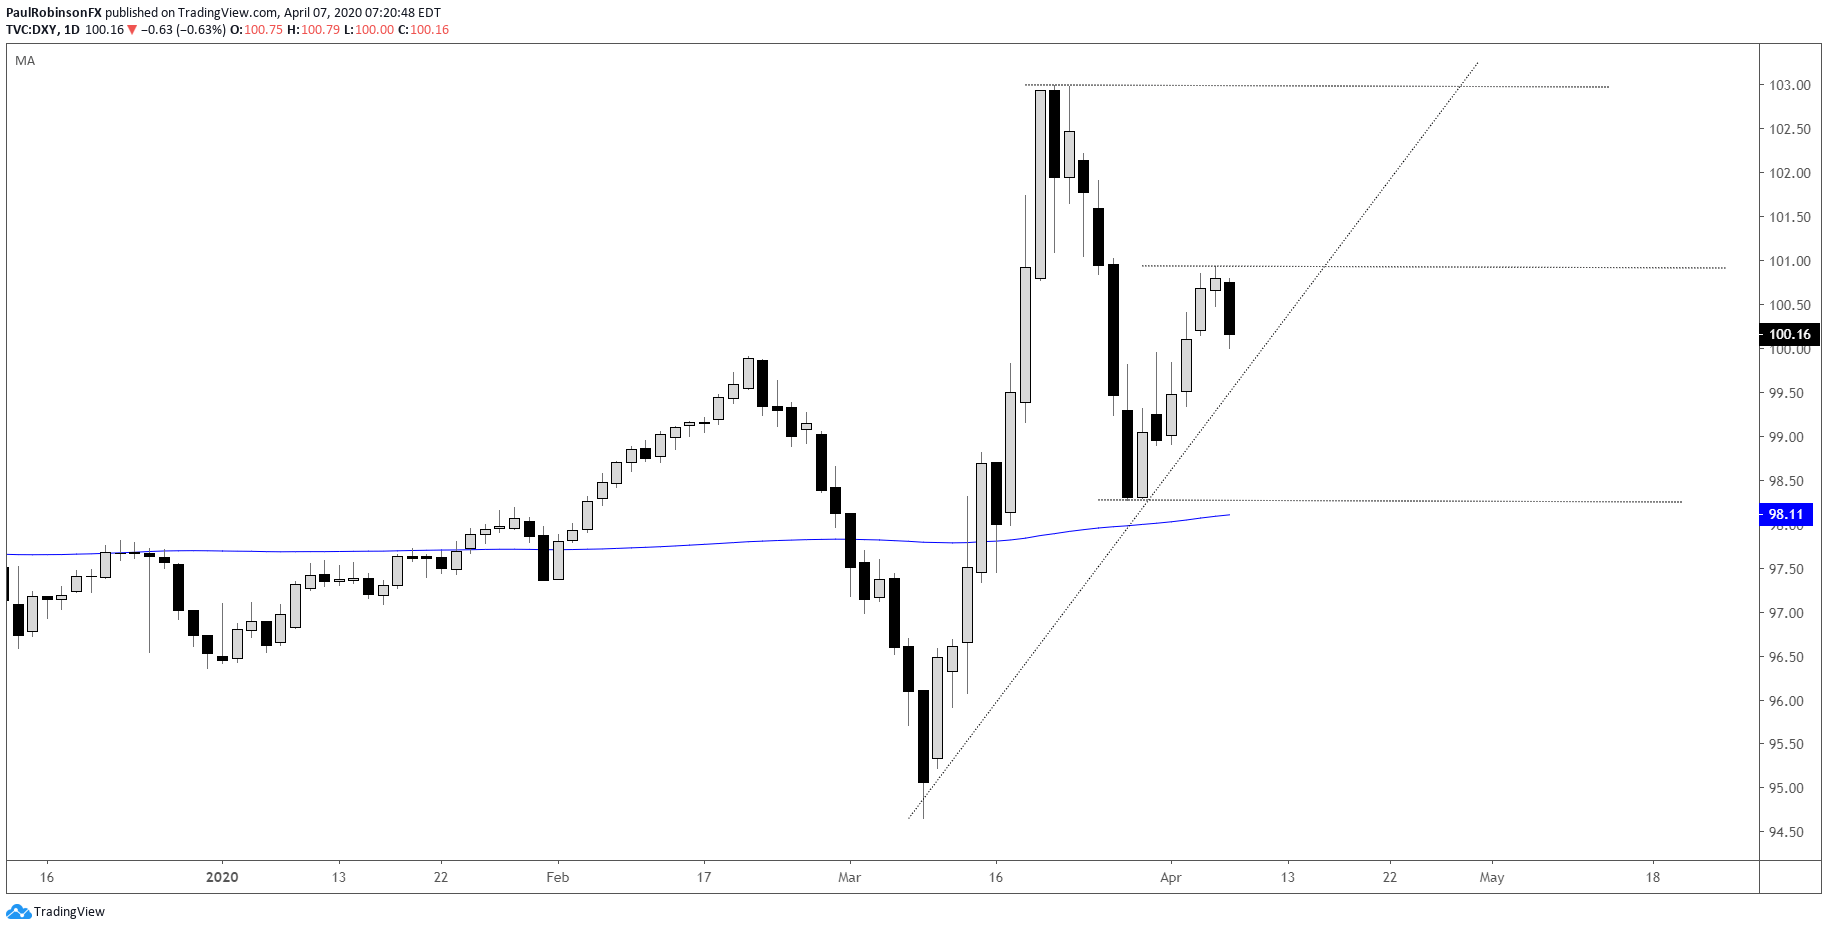
The US Dollar index is mostly at the mercy of what happens with the Euro, as it accounts for a hefty 57% of the index. Right now it is swinging around with limited aim, but a Euro drop will likely have the DXY trading above the 102.99 high created on March 20. Short-term support clocks in at 98.27, which roughly aligns with the 200-day moving average.

US Dollar Index Daily Chart (at the mercy of the euro)
US Dollar Index Chart by TradingView
For all the charts we looked at, check out the video above…
Resources for Index & Commodity Traders
Whether you are a new or an experienced trader, DailyFX has several resources available to help you; indicator for tracking trader sentiment, quarterly trading forecasts, analytical and educational webinars held daily, and trading guides to help you improve trading performance.
We also have a series of guides for those looking to trade specific markets, such as the S&P 500, Dow, DAX, gold, silver, crude oil, and copper.
---Written by Paul Robinson, Market Analyst
You can follow Paul on Twitter at @PaulRobinsonFX


