


CAC 40 & FTSE 100 Price Outlook:
- The CAC 40 has seemingly bounced off a nearby Fibonacci level around 3,500
- FTSE 100 traders can look to target 5,500 should bullishness continue
- Despite released and upcoming economic data, virus headlines will likely dictate price action for both the CAC 40 and FTSE 100
CAC 40 & FTSE 100 Forecasts: Indices Gain Despite Horrid PMI Data
Tuesday saw the release of PMI data for Eurozone economies and the United States, all of which revealed an expected decline in economic activity due to the coronavirus pandemic. Nevertheless, the CAC 40 and FTSE 100 climbed off their recent lows and bullishness spilled over into the first half of the New York trading session. Consequently, the two European indices may take aim at early areas of resistance – should bullishness continue.
CAC 40 Price Chart: Daily Time Frame (July 2018 – March 2020)
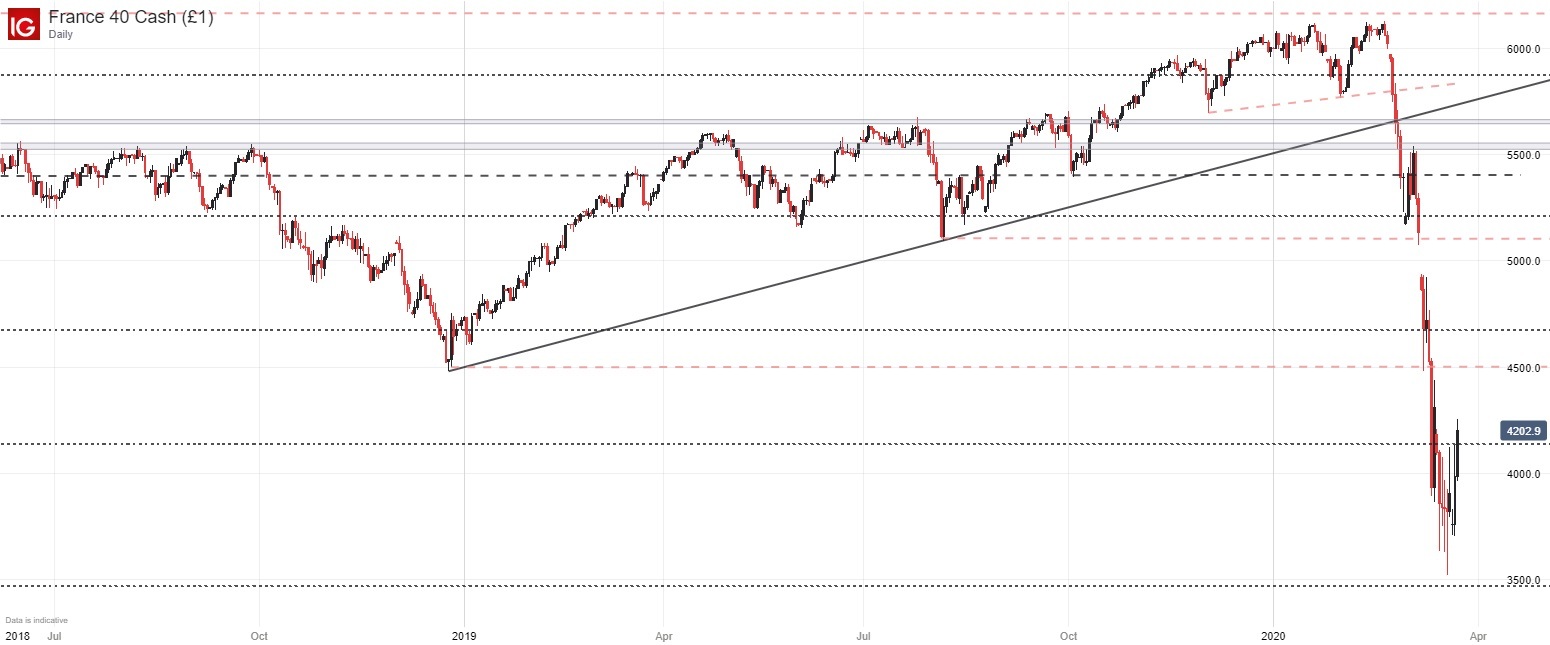
In the case of the CAC 40, it seems a Fibonacci level near 3,500 has helped to temporarily ward off further losses which has allowed the index to make a run at prior support. Posting a daily close around 4,200, CAC traders may take aim at resistance around 4,500 which is derived from the December 2018 low and sparked minor price indecision during the index’s decline earlier in March.
| Change in | Longs | Shorts | OI |
| Daily | -12% | 26% | 1% |
| Weekly | -8% | 4% | -3% |
While there is little to suggest the index is due for a reversal higher, a daily close above the level would be an encouraging development for chartists as it may allow for a subsequent extension beyond. That being said, IG Client Sentiment data reveals retail traders are essentially split down the middle, offering a mixed trading bias.
FTSE 100 Price Chart: Weekly Time Frame (2008 – 2020)

Shifting over to the FTSE 100, recent price action reveals a dramatic decline to two-fold support from 2010 and a more-recent Fibonacci sequence near 4,840. Together, the levels likely played a role in stalling losses and the FTSE can now look to retake 5,500 where yet another Fibonacci level rests alongside the 2016 lows. Should the recovery effort continue, the zone will likely be an early barrier standing in the way of a larger extension higher.
In the meantime, fundamental developments will likely come in the form of coronavirus updates – not economic data as it is widely accepted upcoming prints will miss expectations. Therefore, encouraging price developments like higher highs and higher lows may help simplify the chaos of the fundamental side as global equity markets attempt to stem the bleeding.
--Written by Peter Hanks, Junior Analyst for DailyFX.com
Contact and follow Peter on Twitter @PeterHanksFX


