


EUR/USD Price, News and Analysis:
- EUR/USD chart highlights this week’s bearish momentum.
- Italian bond yields continue to jump higher after ECB comments.
EUR/USD Stuck in a Bearish Rut
The most actively traded currency pair in the market, EUR/USD, continues to slip lower after yesterday’s ECB meeting failed to boost confidence in the single-market’s currency. Thursday’s wild swings saw the pair trade in a near three-big figure range, and current quotes show the pair four-big figures lower from Monday’s 1.1496 high print. Thursday’s daily candle will now likely restrict price action in the near-future.
The Euro is getting mild support from higher Eurozone bond yields after ECB President Christine Lagarde’s comments yesterday that the central bank was ’not here to close spreads’ in the sovereign debt space. This comment caused Italian bond yields, already under pressure due to the coronavirus epidemic, to jump sharply higher, causing the spread between Italian and German bonds to widen sharply. The additional EUR120 billion of QE announced for 2020 may temper these moves in the future, but for now the Euro remains under pressure.
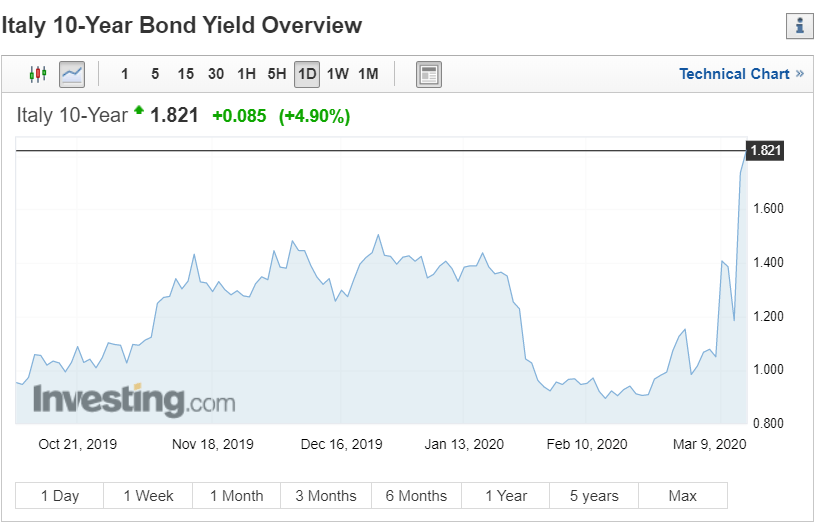
Chart via Investing.com
This week’s price moves have pushed volatility levels in the pair back to highs seen in early February 2019, using the ATR indicator. We noted recently that the longer-term series of lower highs had been broken and this may add a level of support to the pair, but this week’s bearish momentum continues to drive price action. Support may kick-in either side of 1.1100, while the 200-day moving average - the black line on the chart – acted as support yesterday. Financial markets remain extremely volatile and judging any entry and exit points remains difficult especially when the central bank can provide market moving commentary at any time.

EUR/USD Daily Price Chart (September 2019 – March 13, 2020)

For all market moving data and events please the DailyFX calendar
| Change in | Longs | Shorts | OI |
| Daily | -1% | -4% | -3% |
| Weekly | 4% | -10% | -5% |
Traders may be interested in two of our trading guides – Traits of Successful Traders and Top Trading Lessons – while technical analysts are likely to be interested in our latest Elliott Wave Guide.
What is your view on EURUSD – bullish or bearish?? You can let us know via the form at the end of this piece or you can contact the author via Twitter @nickcawley1.


