


Crude Oil Price, Chart and Analysis.
- Crude oil pull-back looks weak and unlikely to last.
- Chart set-up suggests recent four-year+ low may be re-tested.
Tensions Between OPEC and Russia Continue to Weigh on Oil
After Monday’s carnage in the oil market, prices are pushing marginally higher in early turnover, but the relief rally looks weak and with little to justify it. The ongoing spat between OPEC and its non-OPEC allies, primarily Saudi Arabia and Russia, continues and may be taking a turn for the worse. In a recent statement, Saudi Aramco said that it will supply 12.3 million barrels per day to clients in April, up from 9.7 million bpd in March and 300,000 barrels above the companies maximum sustained capacity of 12 million bpd, by dipping into reserves. The increase in output comes after Russia refused to agree to production cuts last week, an action that slammed oil prices lower by over 30% and back to lows last seen in February 2016.

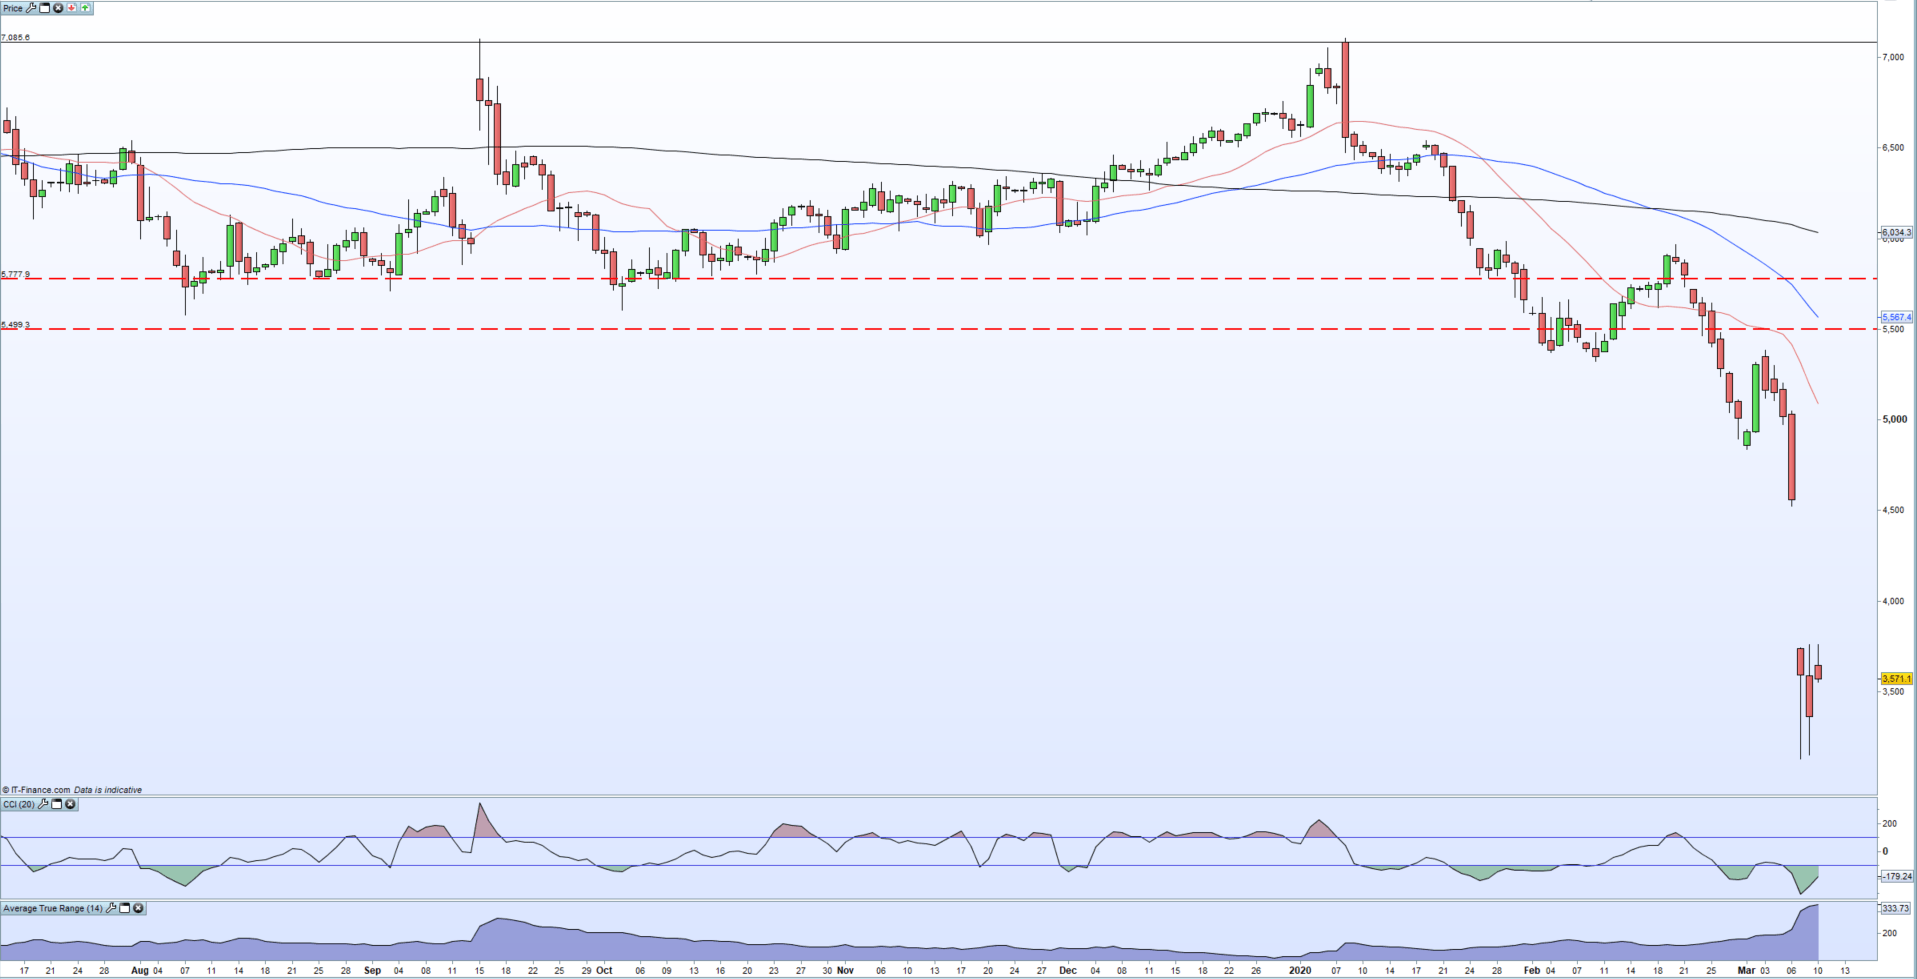
The brent crude oil chart shows the magnitude of Monday’s sell-off with the market gapping lower on the open. For any kind of bullish momentum to set-in, this gap needs to be filled completely, or prices will continue to trend lower. The 50-dma/200-dma crossover in mid-February was a technically bearish signal, and one that continues to play out.
The late-December 2016 low print at $50.20/bbl. provided little in the way of horizontal support and the last three daily candles show a top forming either side of $37.50/bbl. The CCI indicator suggests the market is still heavily oversold, although it has picked-up from yesterday’s nadir, and this may temper any further sharp sell-off.
Crude Oil Daily Price Chart (July 2019 - March 10, 2020)
| Change in | Longs | Shorts | OI |
| Daily | 3% | -7% | 1% |
| Weekly | 31% | -38% | 7% |
Traders may be interested in two of our trading guides – Traits of Successful Traders and Top Trading Lessons – while technical analysts are likely to be interested in our latest Elliott Wave Guide.
What is your view on Crude Oil – bullish or bearish?? You can let us know via the form at the end of this piece or via Twitter @nickcawley1.


