


Bitcoin Outlook:
- Bitcoin has rallied to start the year after slowly bleeding lower in the second half of 2019
- The coin has retaken the 200-day simple moving average and various other technical levels
- Now a Fibonacci level at $9,400 stands between BTC/USD and the psychologically significant $10,000 mark
Bitcoin Price Rally Stalls at Resistance, Will it Reverse?
After an abysmal ending to 2019, Bitcoin has started off the New Year with a strong showing. Rallying from $7,150 to $9,300 in under a month, the coin’s performance has allowed it to recapture key technical levels that it can look to for support in the coming days. That being said, BTC/USD will have to surmount a nearby Fibonacci level if it is to continue its climb.
Bitcoin (BTC/USD) Daily Price Chart
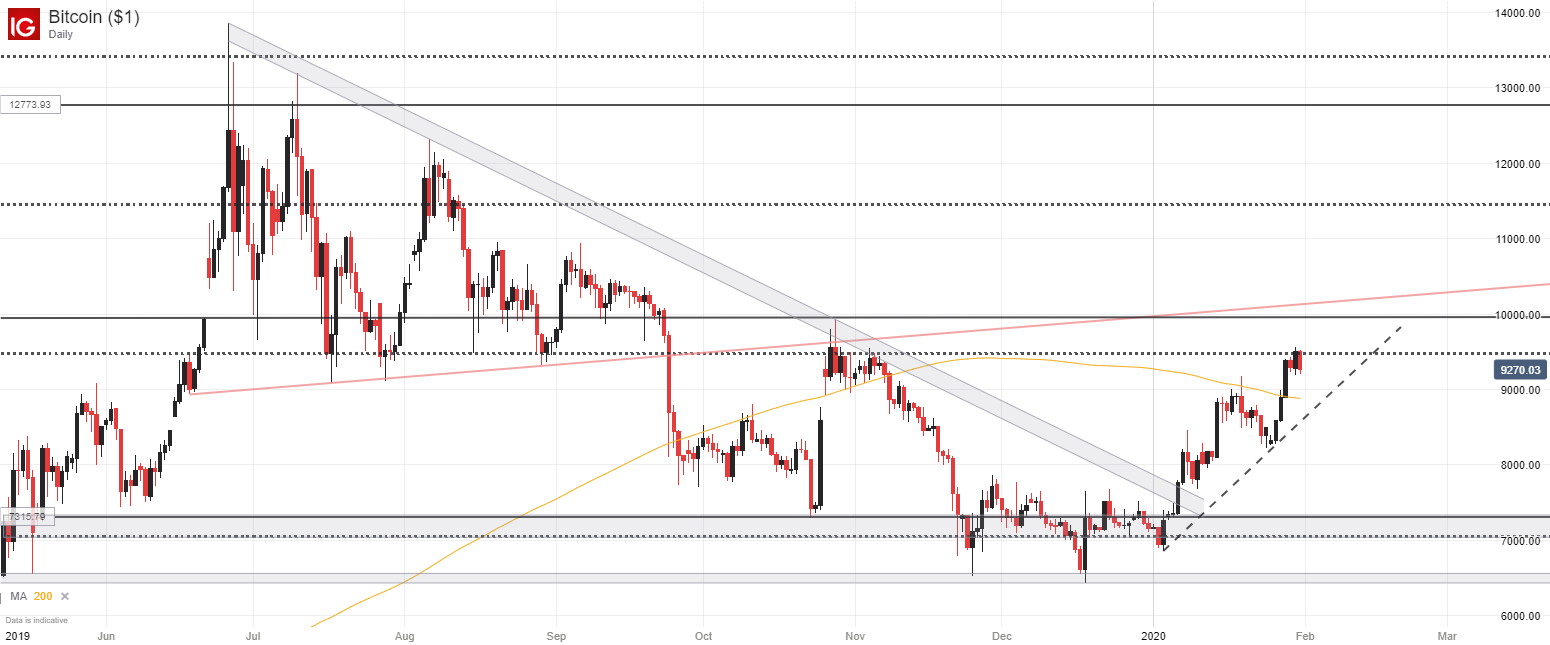
To that end, history suggests the Fibonacci level at $9,400 possesses considerable influence over price. Since June 2018, the line has been able to successfully stall price action numerous times, creating a considerable challenge for bulls who are currently trying to push BTC higher after reclaiming the 200-day simple moving average. That being said, Bitcoin can look to the moving average and a trendline protection around $9,000 as an early area of support that could help the coin consolidate.

Looking to the wider timeframe a break above the Fibonacci level, and eventually the $10,000 mark, would establish a higher-high compared to the October peak. Such a move would be an encouraging sign in pursuit of a longer-term continuation higher as it would help buck the trend of consecutively lower highs and lower lows. Therefore, a confident break and daily close above resistance at $9,400 could allow for further trading opportunities with a bullish bias. In the meantime, follow @PeterHanksFX on Twitter for updates and analysis.
--Written by Peter Hanks, Junior Analyst for DailyFX.com
Contact and follow Peter on Twitter @PeterHanksFX


