


Gold Price, News and Chart
- Fears of a coronavirus breakout continue – WHO update later.
- Gold nears resistance – charts remain supportive.
Gold (XAU/USD) Price Driven by Chinese Flu
The price of gold nears an important near-term resistance level that has capped recent bullish sentiment. The ongoing escalation of the Chinese coronavirus outbreak is now ramping up fears that the spread of the flu-like virus has spread further afield and that attempts by China to quarantine the virus have proved unsuccessful. According to the BBC, the death toll from the virus has now risen to 170, while the Chinese health authorities have said that there are 7.711 confirmed cases in the country, as of January 29. The virus has now reached all of mainland China.
Fears that the virus has spread globally has prompted the World Health Organization (WHO) to call an emergency meeting later today – the third meeting this week – to address the latest outbreak. Tellingly, the WHO recently said that it ‘deeply regrets’ saying that the virus posed only a ‘moderate’ risk this week, putting the mistake down to human error. The virus has spread to at least 12 other countries so far.
Risk Management Techniques for Trading
Gold is now attempting to break a recent double high around $1,589/oz. made on January 5 and January 26. A convincing break and close above here would leave the January 8 spike-high at $1,611.5/oz. vulnerable. Above here, gold would be back at levels last seen in February 2013, when the precious metal was selling off from its September 2011 high of $1,921/oz. peak. There are various horizontal resistance levels that will cut in before then, including the October 2012 swing-high at $1,796/oz.
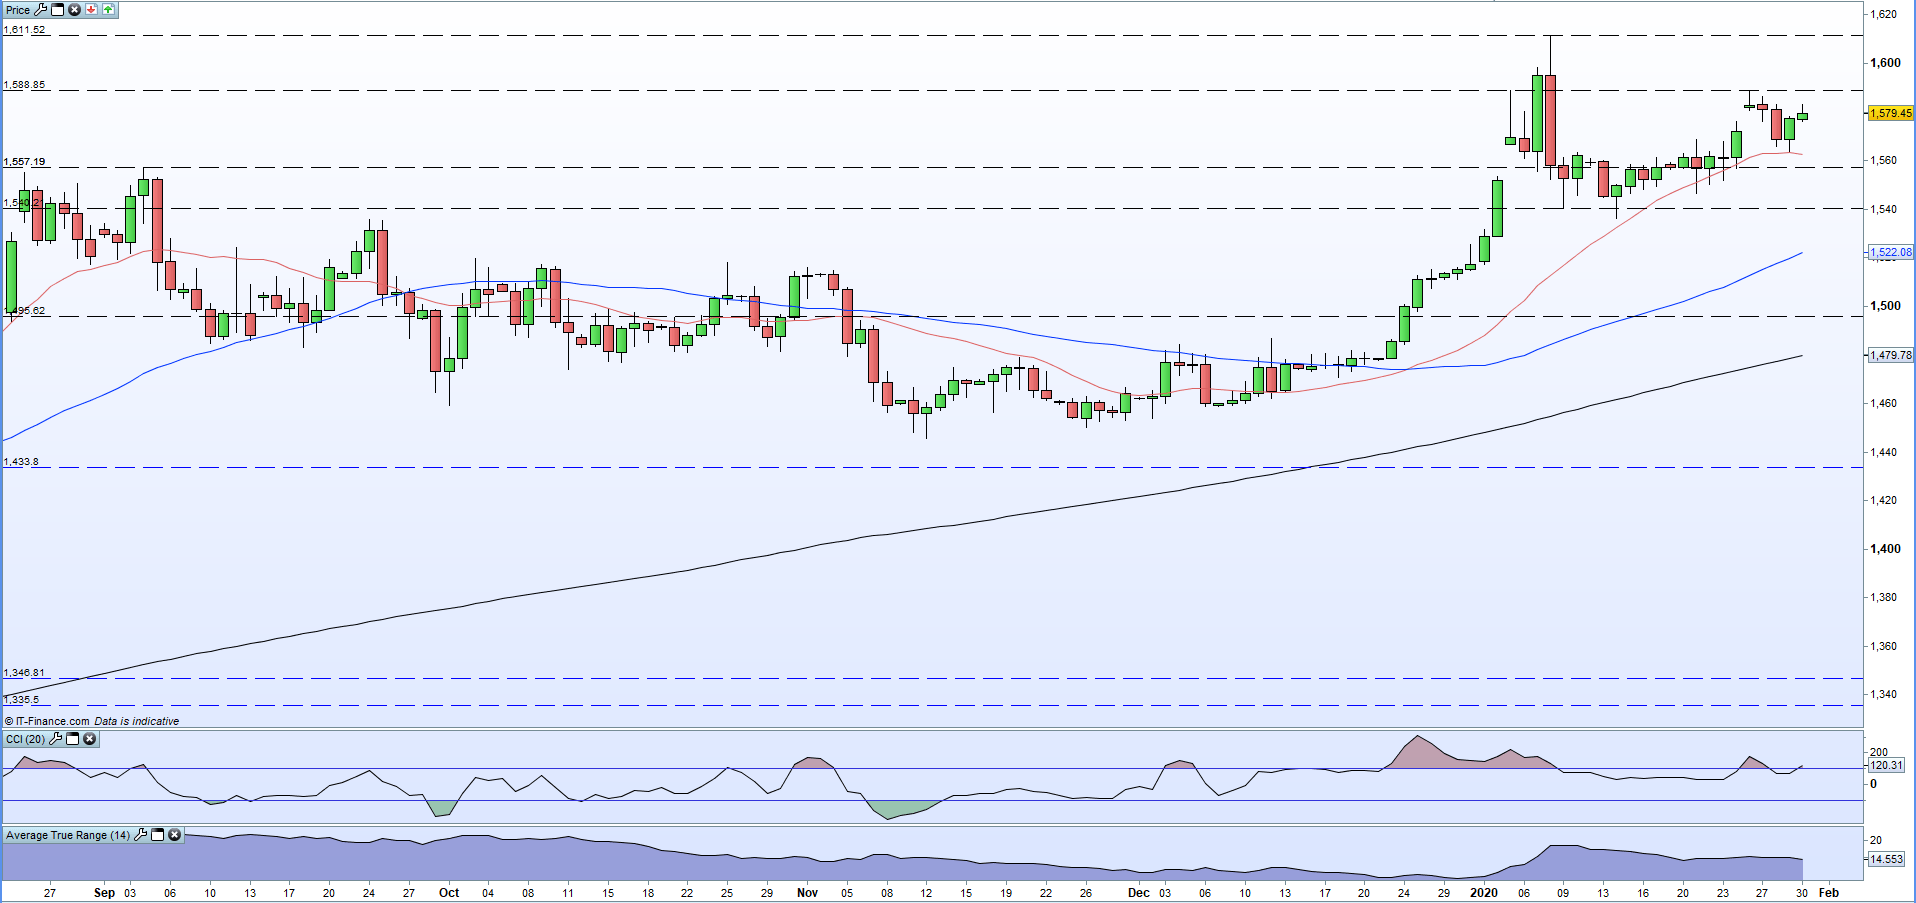
Volatility may well increase sharply in the short-term and traders should be aware that quick moves in either direction may occur until there is a lot more clarity about the spread of the deadly virus. The daily chart shows gold above all three moving averages, while a series of recent higher lows are intact.

Gold Daily Price Chart (July 2019 - January 30, 2020)

Traders may be interested in two of our trading guides – Traits of Successful Traders and Top Trading Lessons – while technical analysts are likely to be interested in our latest Elliott Wave Guide.
What is your view on Gold – bullish or bearish?? You can let us know via the form at the end of this piece or you can contact the author via Twitter @nickcawley1.


