


Gold Prices, FOMC Rate Decision, Jerome Powell, Coronavirus– TALKING POINTS
- Gold, silver prices spiked on coronavirus concerns
- FOMC outlook may undo gains in precious metals
- XAG/USD, XAU/USD showing slowing momentum?
Silver and gold prices may retrace some of their recent gains if the Fed reiterates its neutral position on interest rates and cools 2020 rate cut bets along with demand for anti-fiat hedges. The spike in precious metals has come in large part due to the market-wide panic associated with the spread of the coronavirus which has infected sentiment in Asia, Europe and the US.
S&P 500 Futures, Gold Prices, 10-Year US Treasury Yields, XAG.USD – 15-Minute Chart

S&P 500 futures chart created using TradingView
Gold Technical Analysis
After a period of relatively-directionless trading between the 1551.96 and 1557.10 (gold-dotted lines) support range, gold prices turned higher and continue to trade at seven-year highs. However, recent price action as indicated by the latest candle suggests there was an underlying hope to continue higher but ultimately it lacked conviction. This may precede a gradual decline back to the key support range.
Gold Prices – Daily Chart
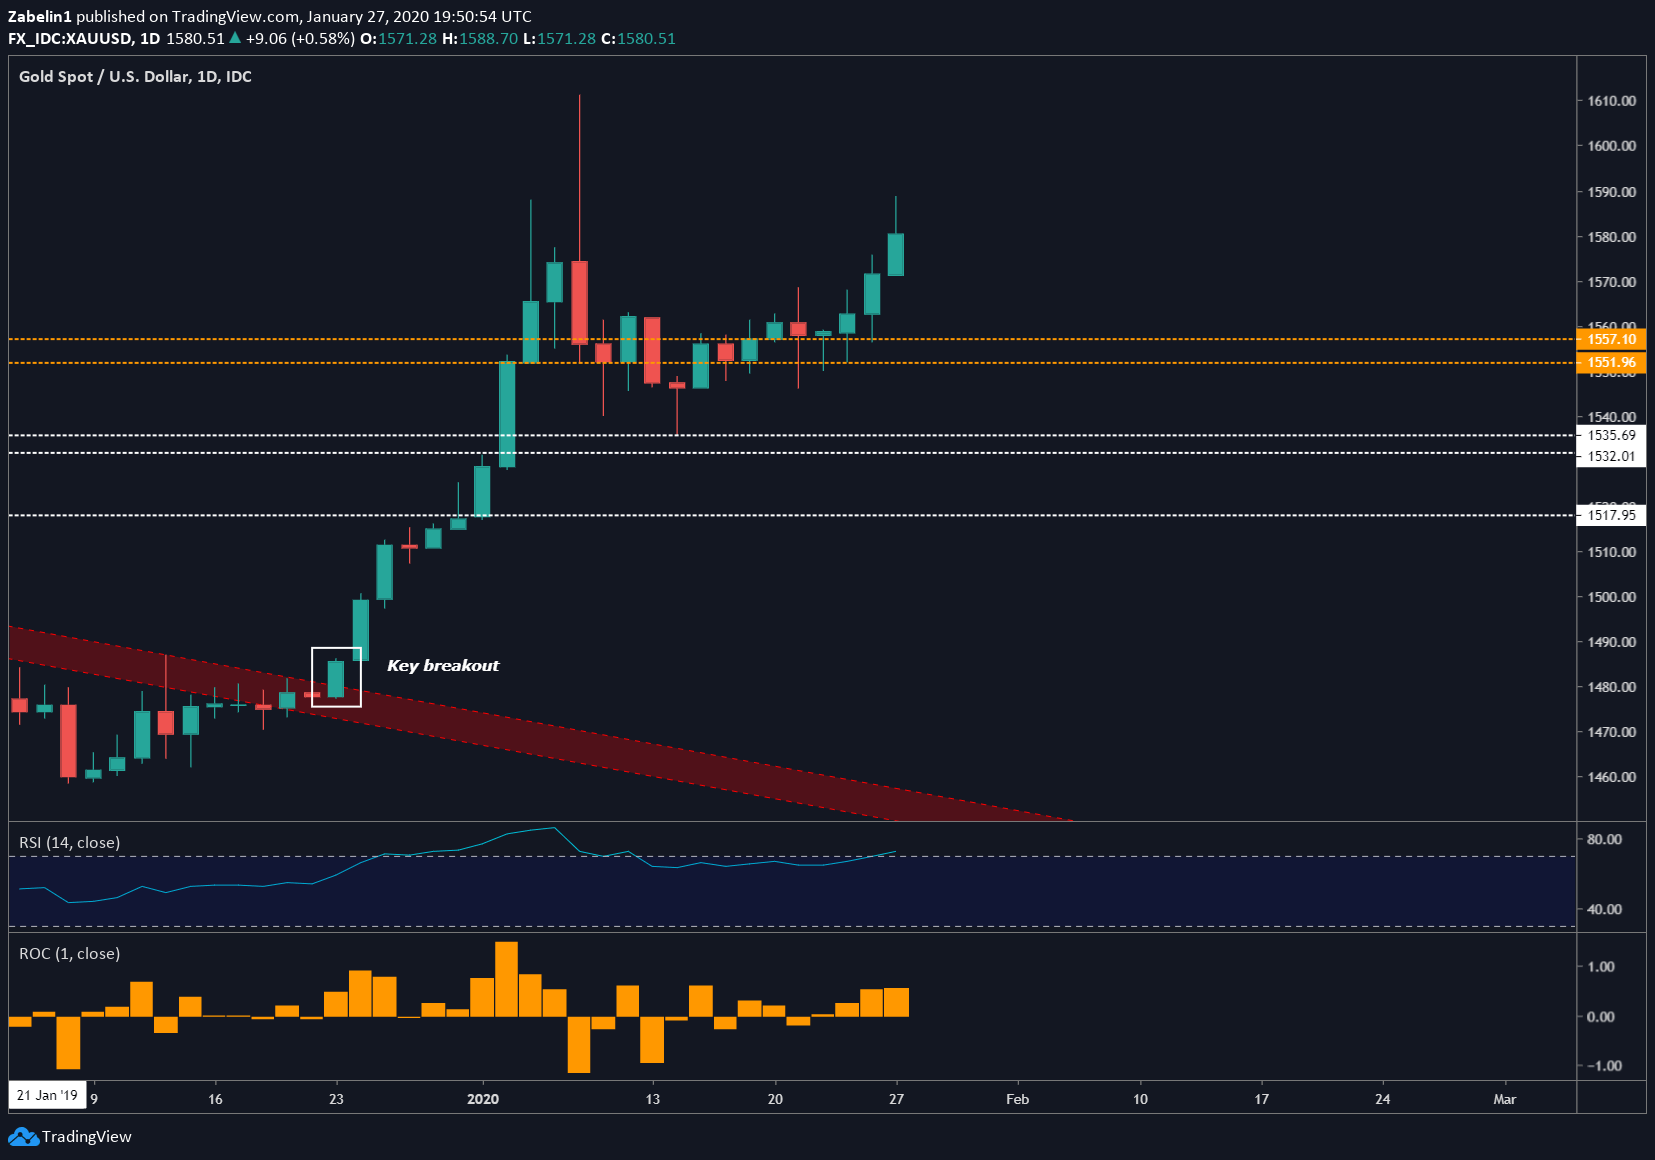
Gold prices chart created using TradingView
The notion of a retreat is also supported on a wider time frame. Negative RSI divergence on a monthly chart points to slowing upside momentum as gold prices continue to climb. While this does not necessarily precede a turn lower, it certainly warrants the attention of traders.
Gold Prices – Monthly Chart

Gold prices chart created using TradingView
Silver Technical Analysis
Since late December, silver prices have remained range-bound between 17.733 and 18.110 (white-dotted lines) despite attempts to climb above the upper crust. Looking ahead, a retreat to the lower layer may be in the cards. If XAG/USD breaks support with follow-though it could open the door to testing another floor at 17.440. A fundamental catalyst – like the FOMC rate decision – may be needed to facilitate this move.
Silver Prices – Daily Chart

Silver prices chart created using TradingView
GOLD PRICES TRADING RESOURCES
- Tune into Dimitri Zabelin’s webinar outlining geopolitical risks affecting markets in the week ahead !
- New to trading? See our free trading guides here !
- Get more trading resources by DailyFX !
--- Written by Dimitri Zabelin, Jr Currency Analyst for DailyFX.com
To contact Dimitri, use the comments section below or @ZabelinDimitri on Twitter


