


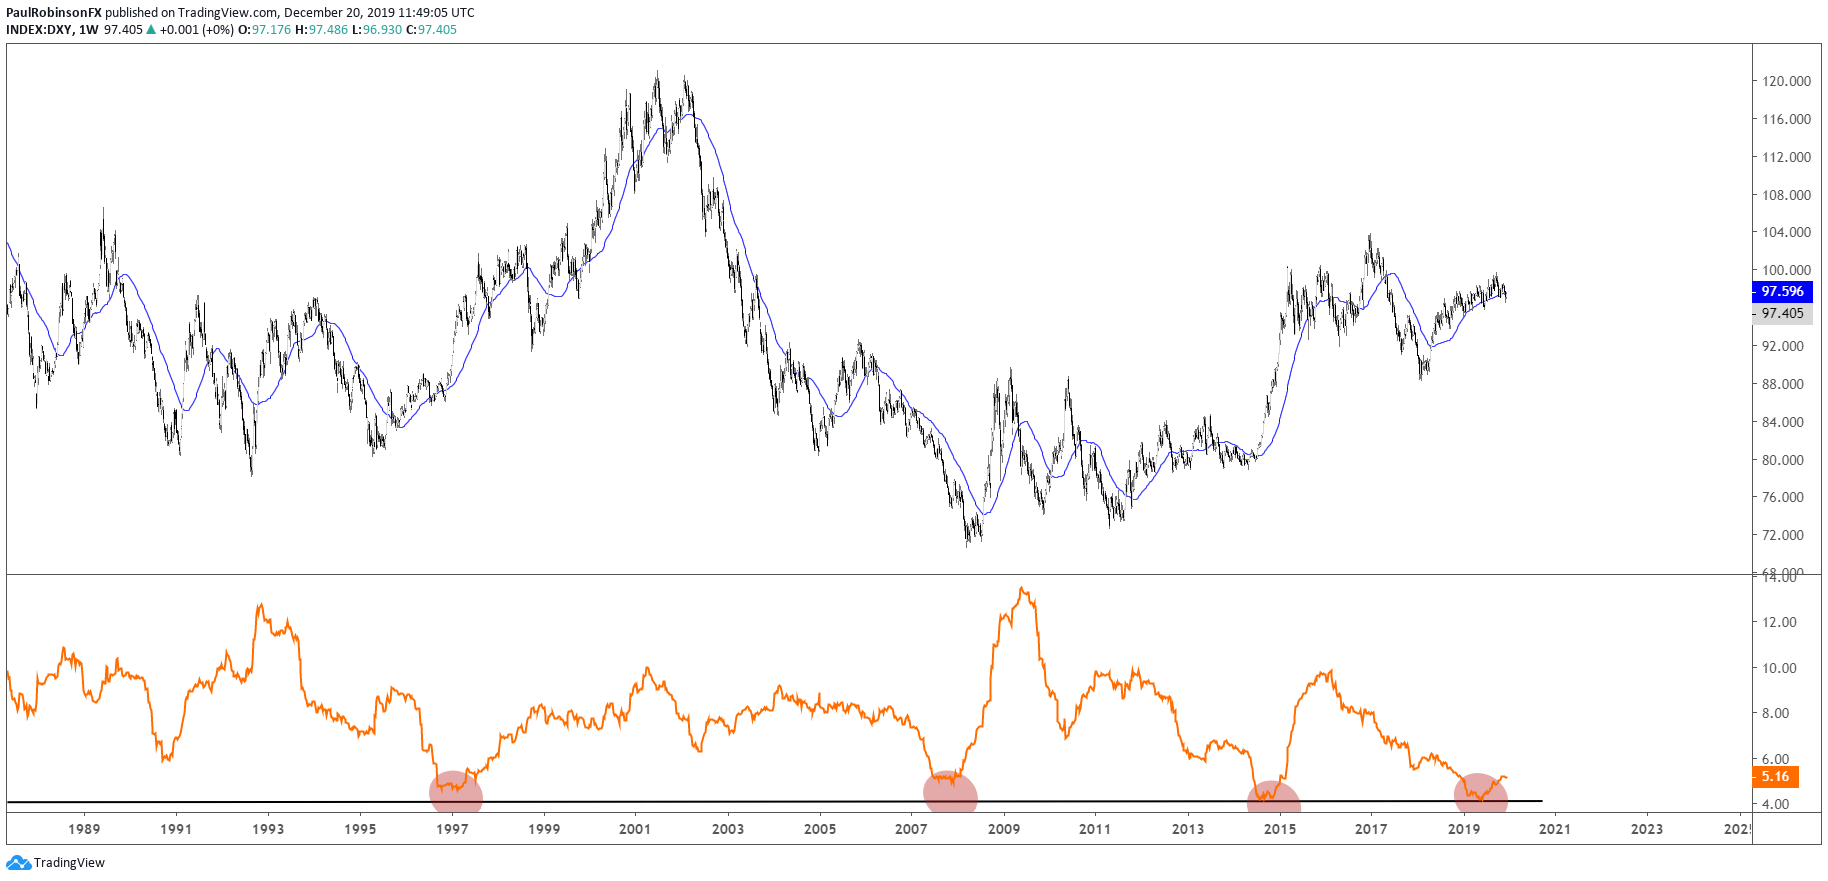
The US Dollar Index (DXY) is very near closing the year with its smallest annual range since 1976, an unsustainable feat. The fact that volatility has gotten so compressed means we will almost certainly see at least some type of uptick, which can only benefit traders (assuming you are not short volatility). It might not be a massive explosion in volatility but even if it were a reversion back towards the long-term mean that would be good enough for creating considerably more opportunities than what we saw in 2019.
US Dollar Index Weekly Chart (52-wk historical volatility low)
EUR/USD chart below is a stitched together version of what it would have looked like before the Euro even came into existence. Being that it accounts for the majority (~57%) of the DXY index we can see that the Euro of course reflects the same volatility pattern. Notice how long-term volatility ebbs over time, from low to high and back again. The same cycles over and over despite drivers of each one being different.
EUR/USD Weekly Chart (volatility ebbing)

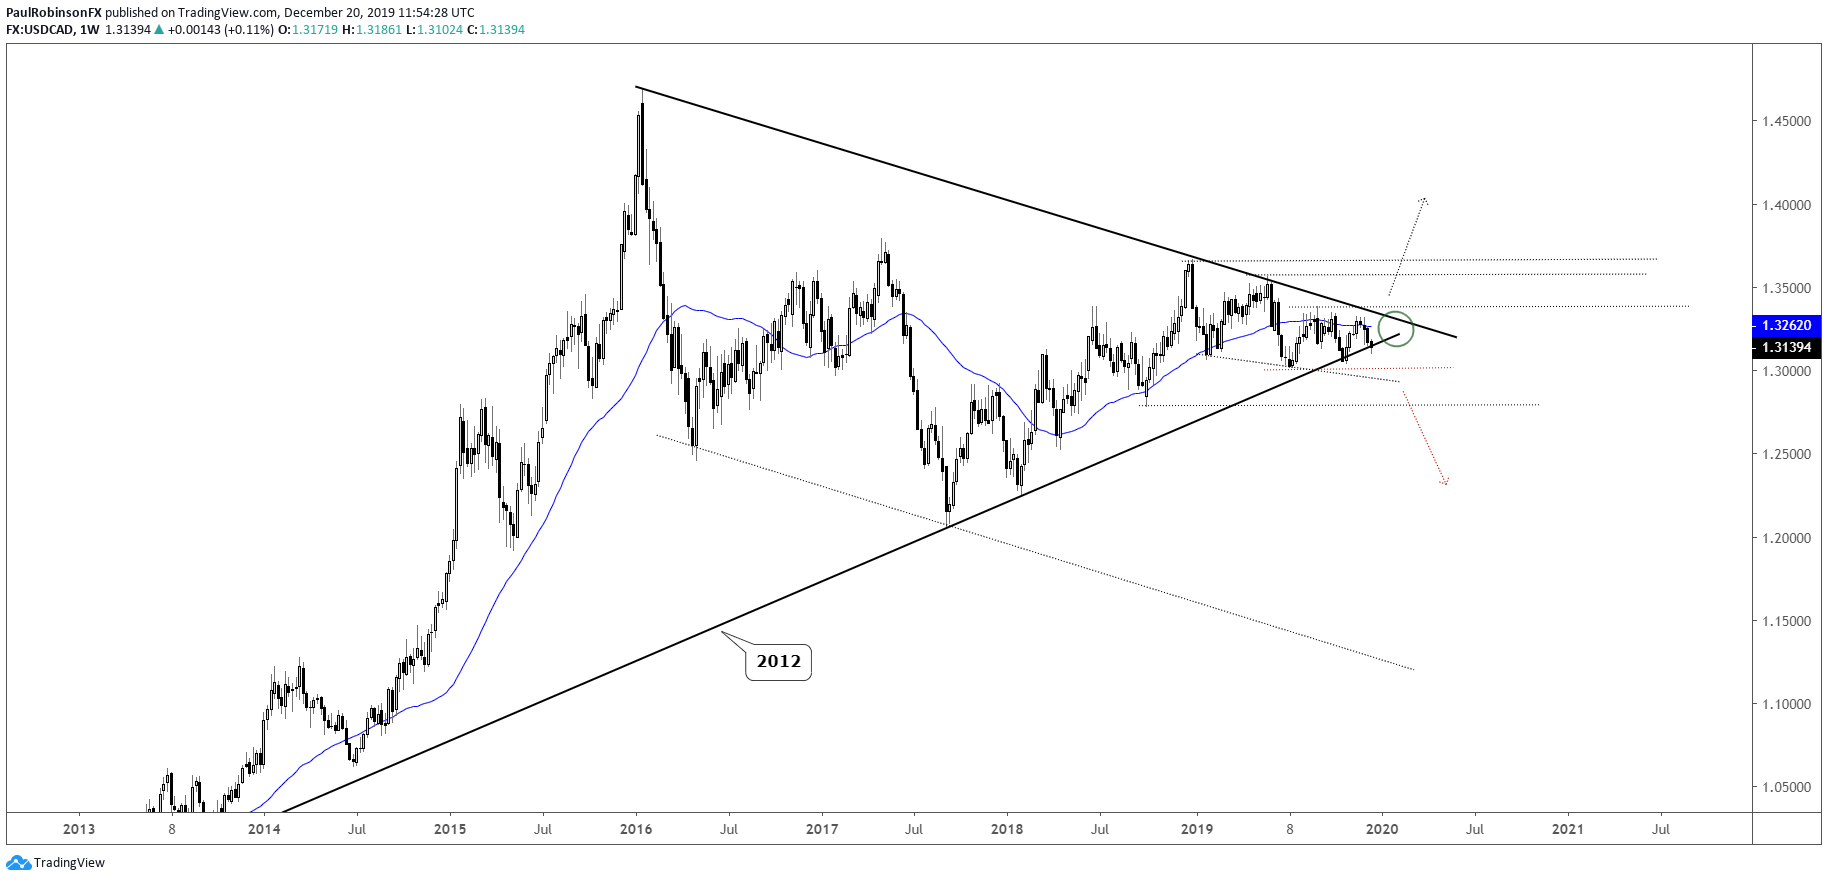
USD/CAD is an interesting one, it not only has the lowest level of volatility since 1996, but has done so with sequentially declining volatility over each quarter. This suggests a breakout could begin in the next couple of months.
USD/CAD Weekly Chart (nearing a ‘make or break’ point)
For all the charts we looked at, check out the video above…
Resources for Index & Commodity Traders
Whether you are a new or an experienced trader, DailyFX has several resources available to help you; indicator for tracking trader sentiment, quarterly trading forecasts, analytical and educational webinars held daily, and trading guides to help you improve trading performance.
We also have a series of guides for those looking to trade specific markets, such as the S&P 500, Dow, DAX, gold, silver, crude oil, and copper.
---Written by Paul Robinson, Market Analyst
You can follow Paul on Twitter at @PaulRobinsonFX


