


The US Dollar Index (DXY) continues to look lower as the trend of recent has been pointed lower and will likely remain that way until support is met. But it’s not just any support, it’s the bottom of a channel that has been in place for well over a year now. It will be important for the DXY to hold if it is to keep from running the risk of falling apart.
US Dollar Index (DXY) Daily Chart (nearing support)

US Dollar Index (DXY) Chart by TradingView
EUR/USD is about 57% of the DXY, and as by far and away the largest constituent of the index it will be the likely driver. Sterling could of course make a huge move later this week on the UK general election, but as only about 12% of the DXY it isn’t likely to move the needle to far. The Euro is looking at a corresponding line of resistance as to the Dollar Index via a trend-line from September 2018, and additionally there is the 200-day MA in confluence with the trend-line. A move to that point will be of interest in how the market reacts.

EUR/USD Daily Chart (watch move to Sep ’18 t-line/200-day)

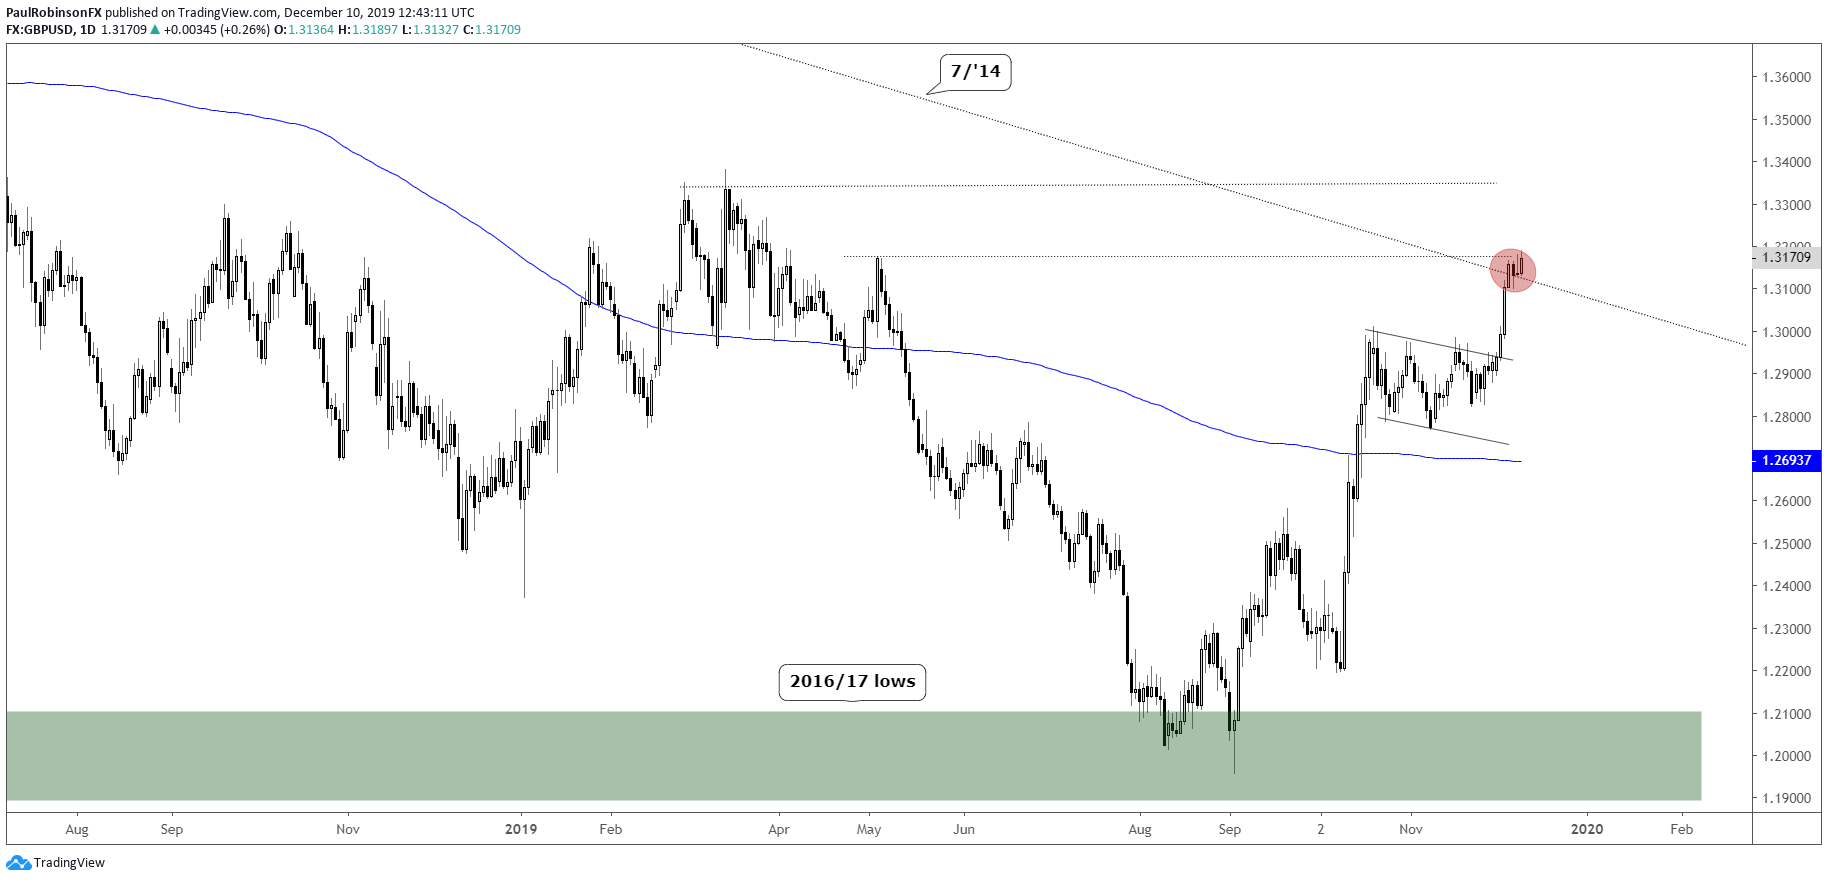
GBP/USD is at a significant trend-line, but to make any plays off it right now either way may not be too fruitful with them market in a holding pattern until the vote. As it stands, though, the market is pricing in a positive GBP outcome and as such the risk is quickly becoming skewed lower. The further Sterling extends from here the more this skew will appear to be stretched.
GBP/USD Daily Chart (trying to break July ’14 trend-line)
Silver remains the preferred short between it and gold, with it continuing to act poorly relatively speaking. It recently broke a bear-flag and looks headed towards the 200-day and a double-top created earlier in the year. From there we might see another upside reaction, possibly more.
Silver Daily Chart (watch weakness to 200-day, earlier-year tops)

For the full set of technical details and charts, check out the video above…
Resources for Index & Commodity Traders
Whether you are a new or an experienced trader, DailyFX has several resources available to help you; indicator for tracking trader sentiment, quarterly trading forecasts, analytical and educational webinars held daily, and trading guides to help you improve trading performance.
We also have a series of guides for those looking to trade specific markets, such as the S&P 500, Dow, DAX, gold, silver, crude oil, and copper.
---Written by Paul Robinson, Market Analyst
You can follow Paul on Twitter at @PaulRobinsonFX


