


Bitcoin (BTC) Price Chart Forecast:
- After breaking beneath support at $7,100 in late November, Bitcoin has rebounded to $7,400
- The move simultaneously created a series of higher lows which is an encouraging sign for the shorter-term forecast
- While Bitcoin has enjoyed a modest reprieve, the longer-term downtrend may remain intact
Bitcoin Price Forecast: Bulls Retreat as BTCUSD Threatens Breakdown
Amidst weeks of declines, Bitcoin’s recent formation of an inverse head-and-shoulders pattern allowed for a brief recovery above $7,000 – rescuing an important technical level. The move simultaneously created a series of higher lows, an encouraging sign for the shorter-term forecast, but bullish interest looks to be waning. Despite the series of higher lows, Bitcoin was unable to establish higher highs, a sign the recovery effort may soon fizzle out and send Bitcoin slipping back to support around $7,000.
Bitcoin Price Chart: 4 - Hour Time Frame (October – December) (Chart 1)
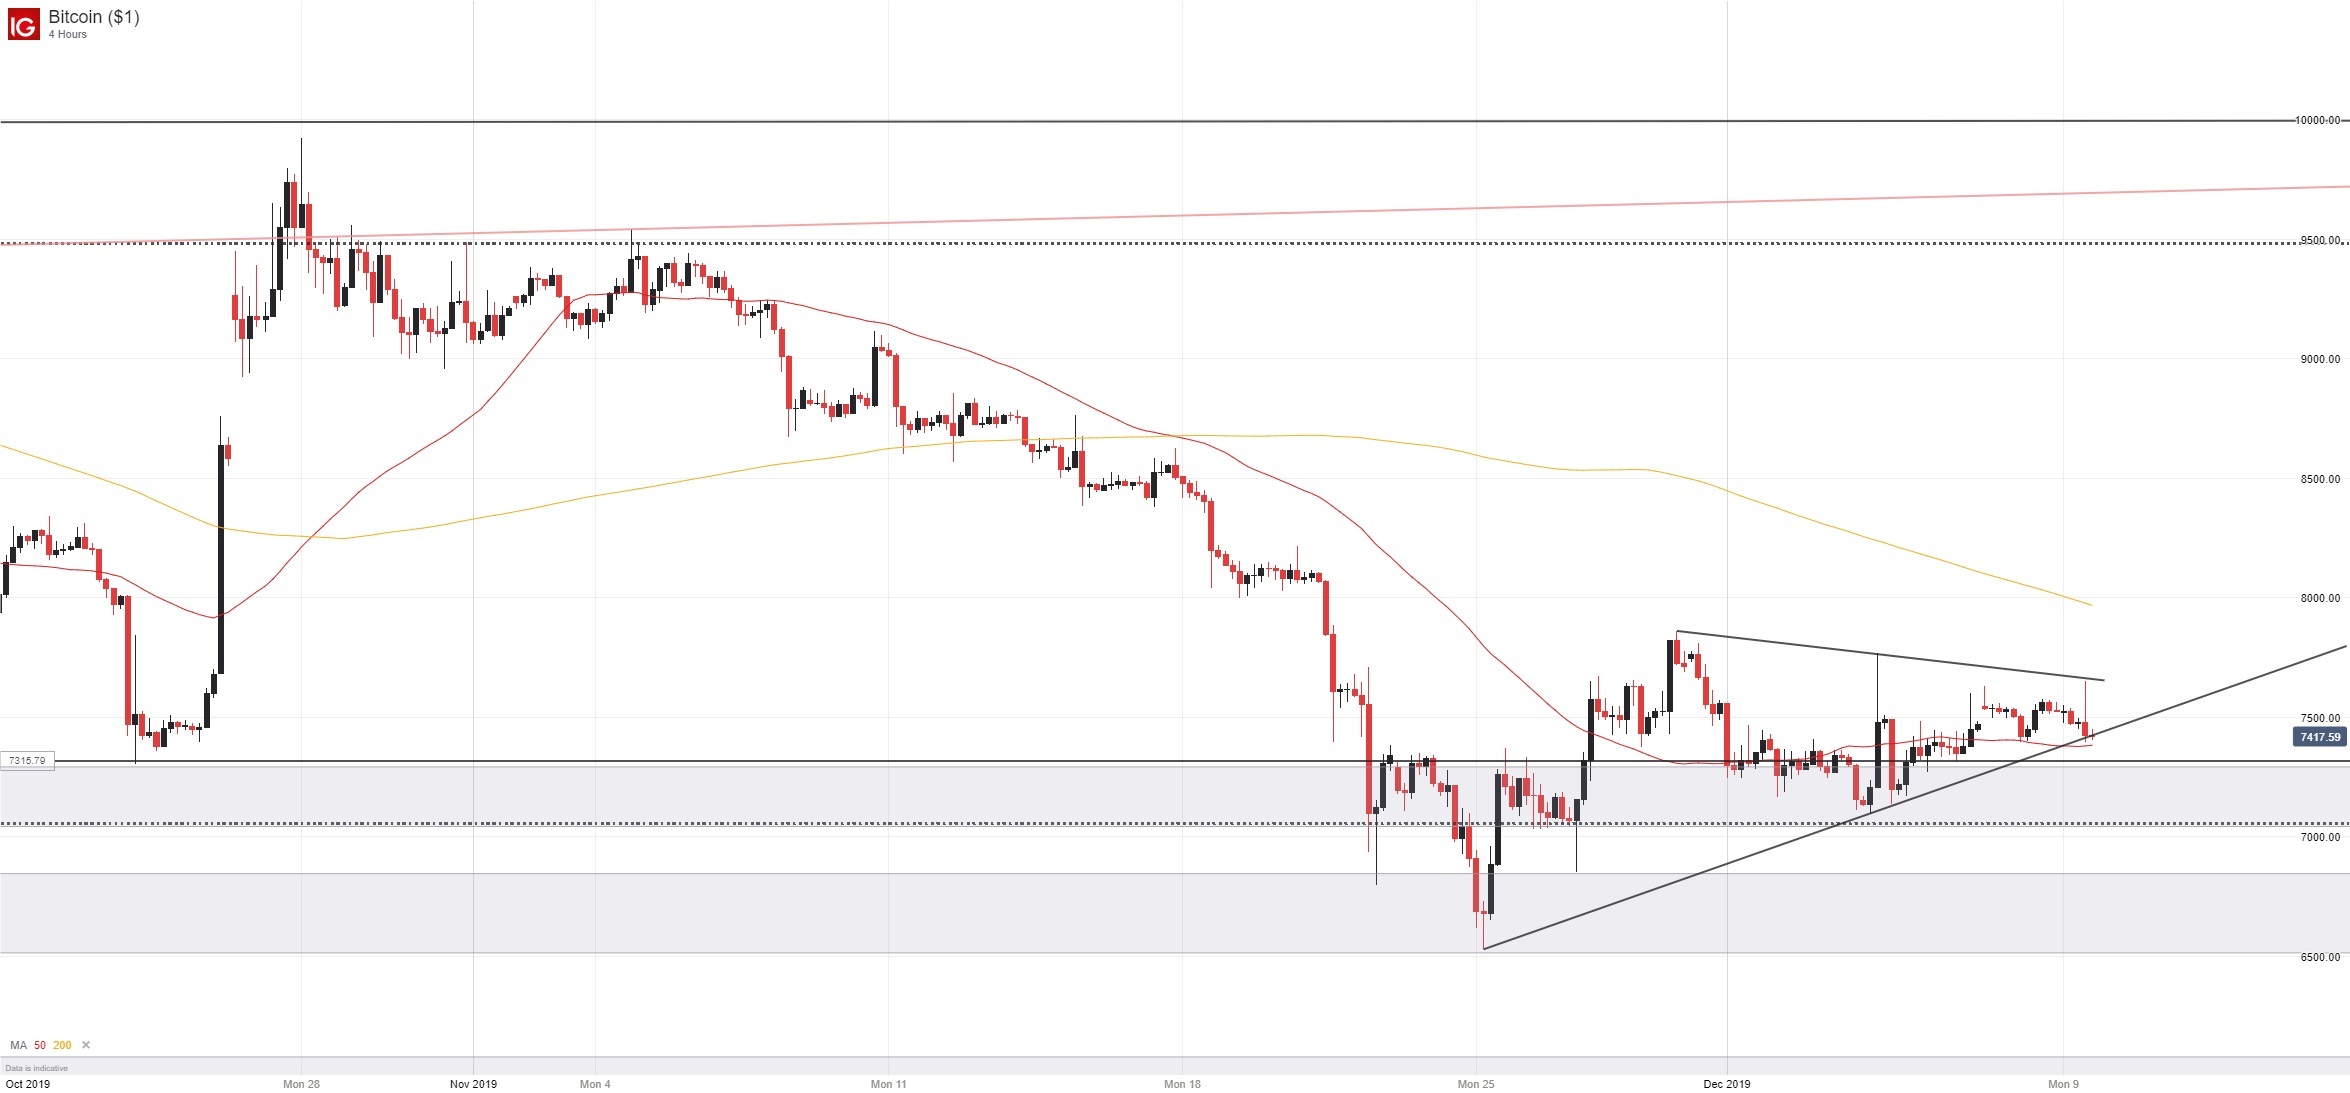
To that end, bulls may have missed out on an opportunity to break the coin’s longer-term downtrend and usher in an extension higher. Now, their initial effort may morph into disaster recovery if support at $7,100 to $7,000 fails to hold again. To that end, traders should watch for a lower low beneath the December 4 bottom around the $7,090 level. A drive beneath the swing low would invalidate the series of higher lows and seriously erode the shorter-term outlook.
Bitcoin Price Chart: Daily Time Frame (June – December) (Chart 2)
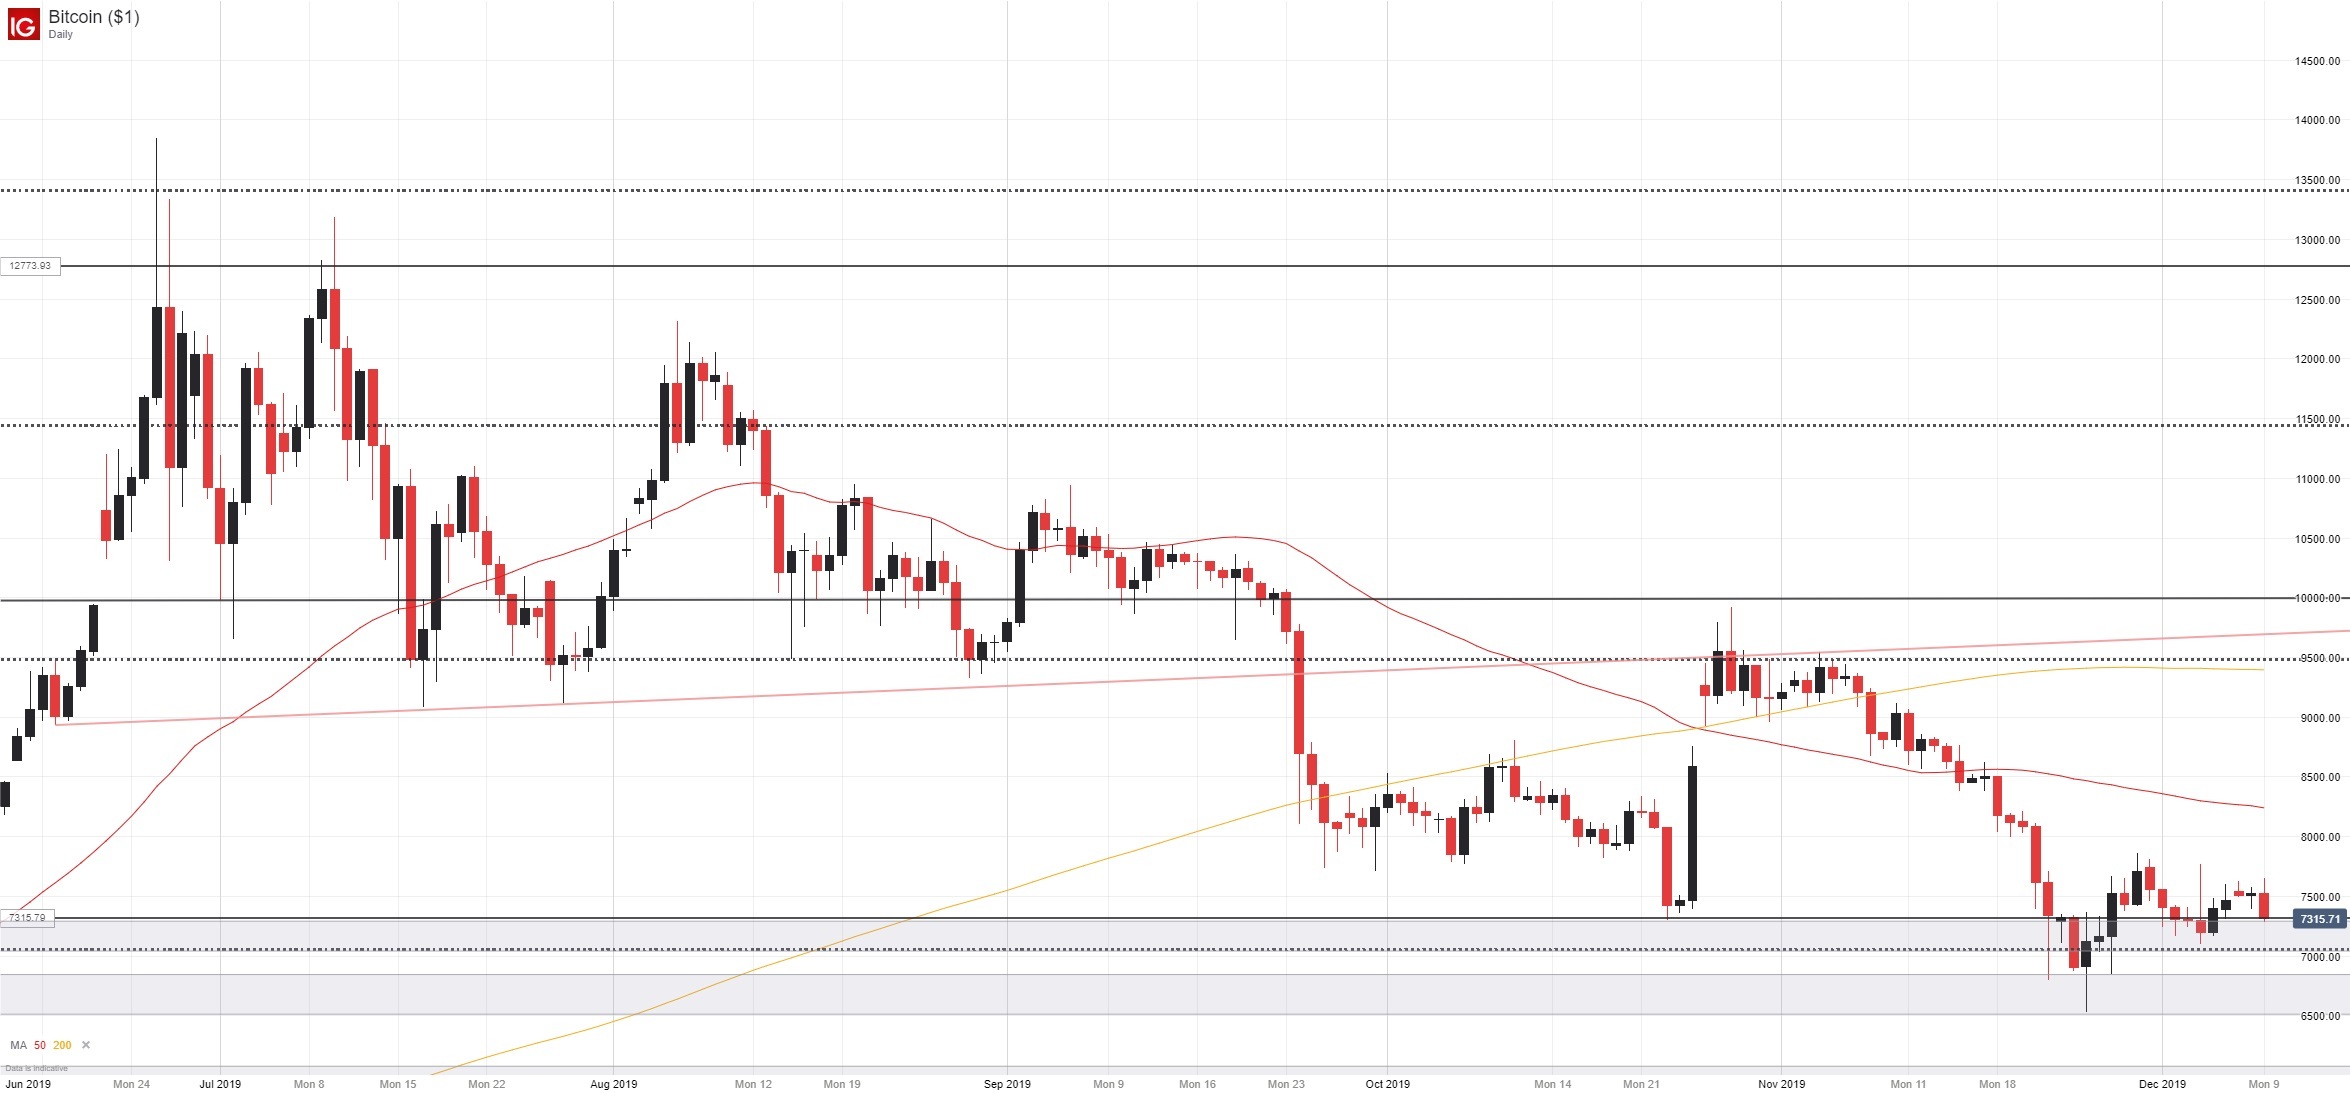
Over the longer time frame, Bitcoin still appears weak as evidenced by the series of lower highs dating back to June. Further, IG Client Sentiment data reveals traders are overwhelmingly long the cryptocurrency – a sign BTC may face further losses. While bears and bulls battle it out, follow @PeterHanksFX on Twitter for Bitcoin news and analysis.

--Written by Peter Hanks, Junior Analyst for DailyFX.com
Contact and follow Peter on Twitter @PeterHanksFX
Read more: Stock Market Crashes: Current Climate Compared to Prior Conditions


