


The US Dollar Index (DXY) has taken a sudden turn lower that may be an indication it wants to reverse course, perhaps in a meaningful way. But before thinking to macro about what the recent string of weakness could mean, we must look to support around the November 18 swing-low, and more importantly the 200-day MA. A hold there may stem off more selling and see the DXY turn back higher, but a break will have an important test of the September 2018 trend-line that has helped keep the index moving higher. It would be a solid spot for would-be longs from a risk/reward perspective, while for shorts a break could mean a significant sell-off is underway.
US Dollar Index (DXY) Daily Chart(watch 200-day, trend-line)
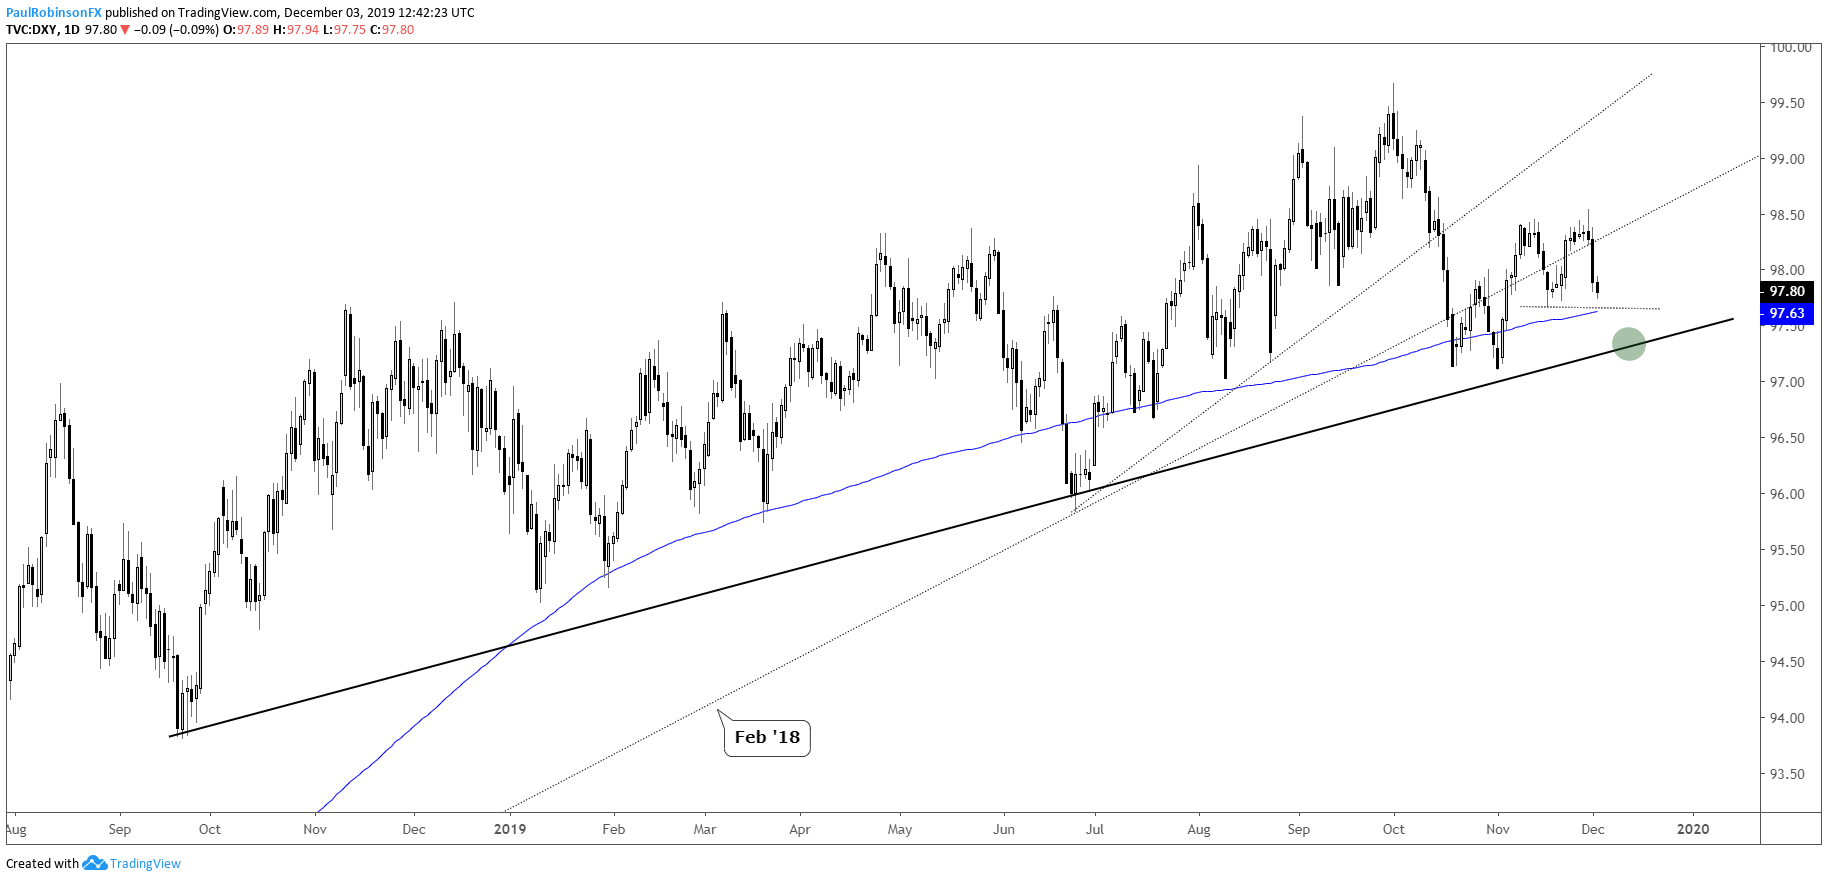
US Dollar Index (DXY) Chart by TradingView
EUR/USD is currently at a spot of importance. The line running across current levels has numerous inflection points, whether they be highs, lows, or closes, since the very end of July. Yesterday may have been a one-off spike higher, but we will know more on that soon. If the rally can hold and garner more strength, then an important test of the September 2018 trend-line and 200-day MA could quickly come into view. A breakdown that negates the recent surge could mean the Euro will sustain under 11000 and potentially trade to a new cycle low below 10879. The next few days could be quite important.
EUR/USD Daily Chart (at an important spot)

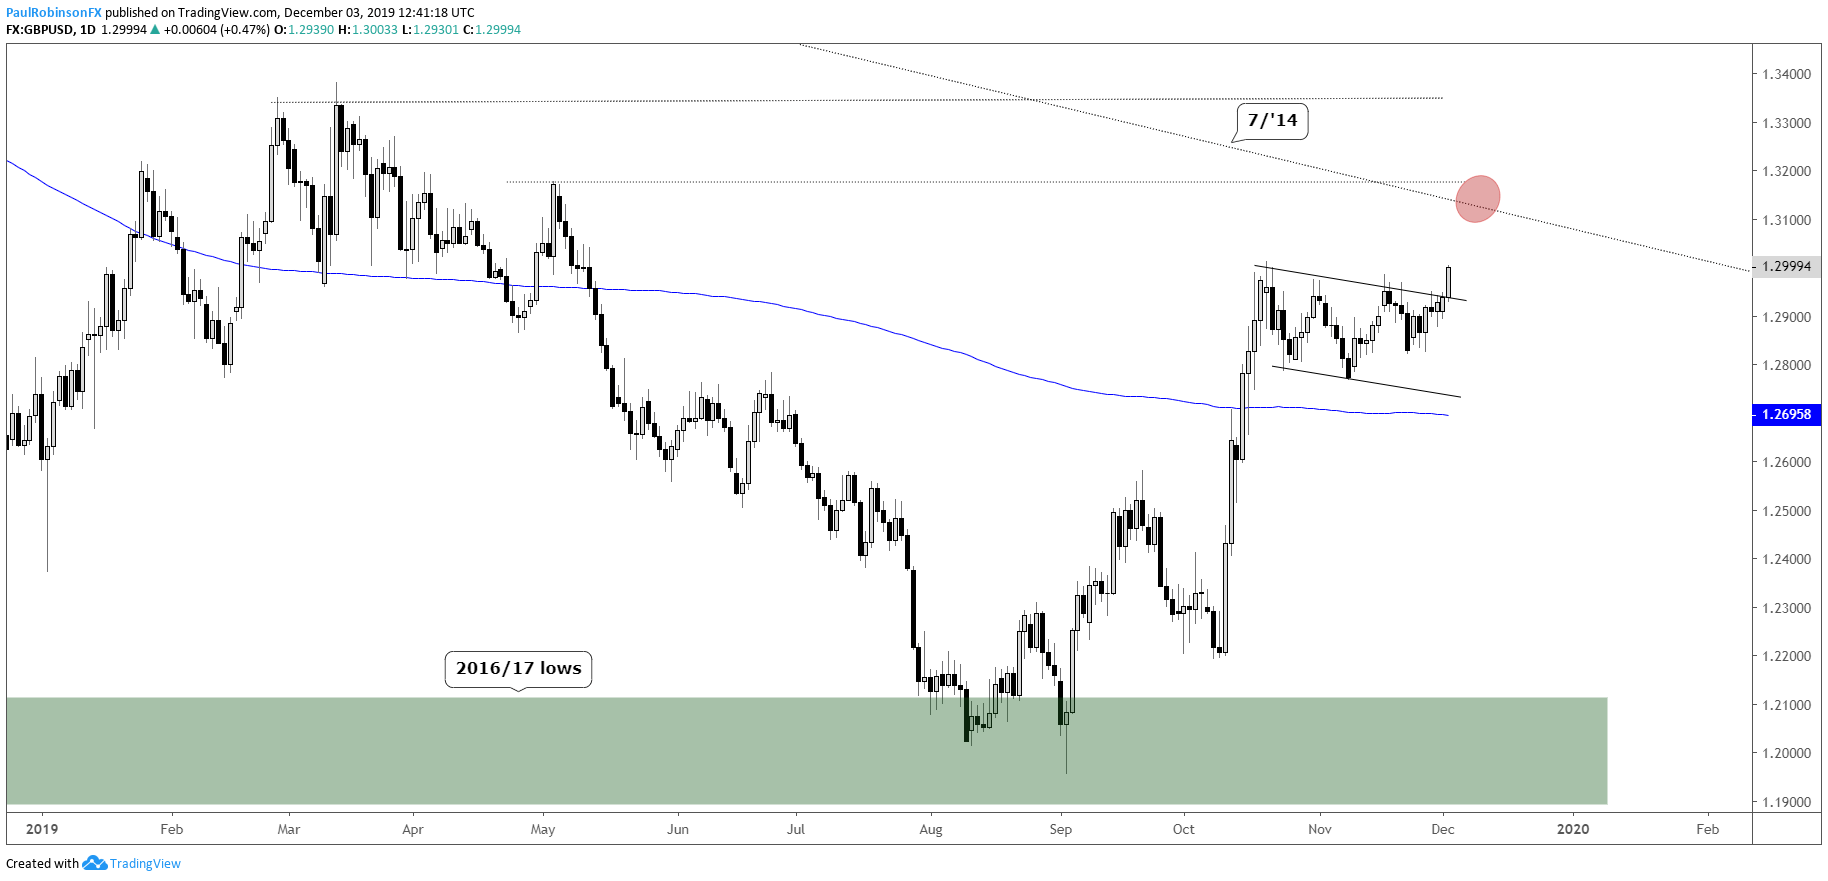
GBP/USD has a bullish-looking price sequence underway as it is starting to come out of a nice consolidation pattern. A break above 13012 should have Cable rolling the trend-line from July 2014, which also runs over the 2018 high. The strong connecting points make it a big trend-line to watch over 13100.
GBP/USD Daily Chart (bullish-looking price sequence)
For the full set of technical details and charts, check out the video above…
Resources for Index & Commodity Traders
Whether you are a new or an experienced trader, DailyFX has several resources available to help you; indicator for tracking trader sentiment, quarterly trading forecasts, analytical and educational webinars held daily, and trading guides to help you improve trading performance.
We also have a series of guides for those looking to trade specific markets, such as the S&P 500, Dow, DAX, gold, silver, crude oil, and copper.
---Written by Paul Robinson, Market Analyst
You can follow Paul on Twitter at @PaulRobinsonFX


