


FTSE 100 & CAC 40 Forecasts:
- The FTSE 100 is days away from delivering a widely-watched bearish signal
- The CAC 40 enjoys a more optimistic outlook, but could join the FTSE if bearish price action reignites
- Dow Jones & DAX 30 Forecasts: Indices Show Signs of Vulnerability
FTSE 100 Threatens a Death Cross, CAC 40 Has Time Yet
FTSE 100 Forecast
The FTSE 100 finds itself in a precarious position after slipping beneath its 200-day moving average last week. While the fundamental side remains in constant flux - with developments in the Brexit debacle unfolding each day - the technical side has become increasingly bearish as of late and another blow could be dealt if the 50-day moving average slips beneath the 200-day. If this occurs, it would mark yet another index signaling the bearish death-cross formation.
FTSE 100 Price Chart: Daily Time Frame (May 2018 – October 2019) (Chart 1)
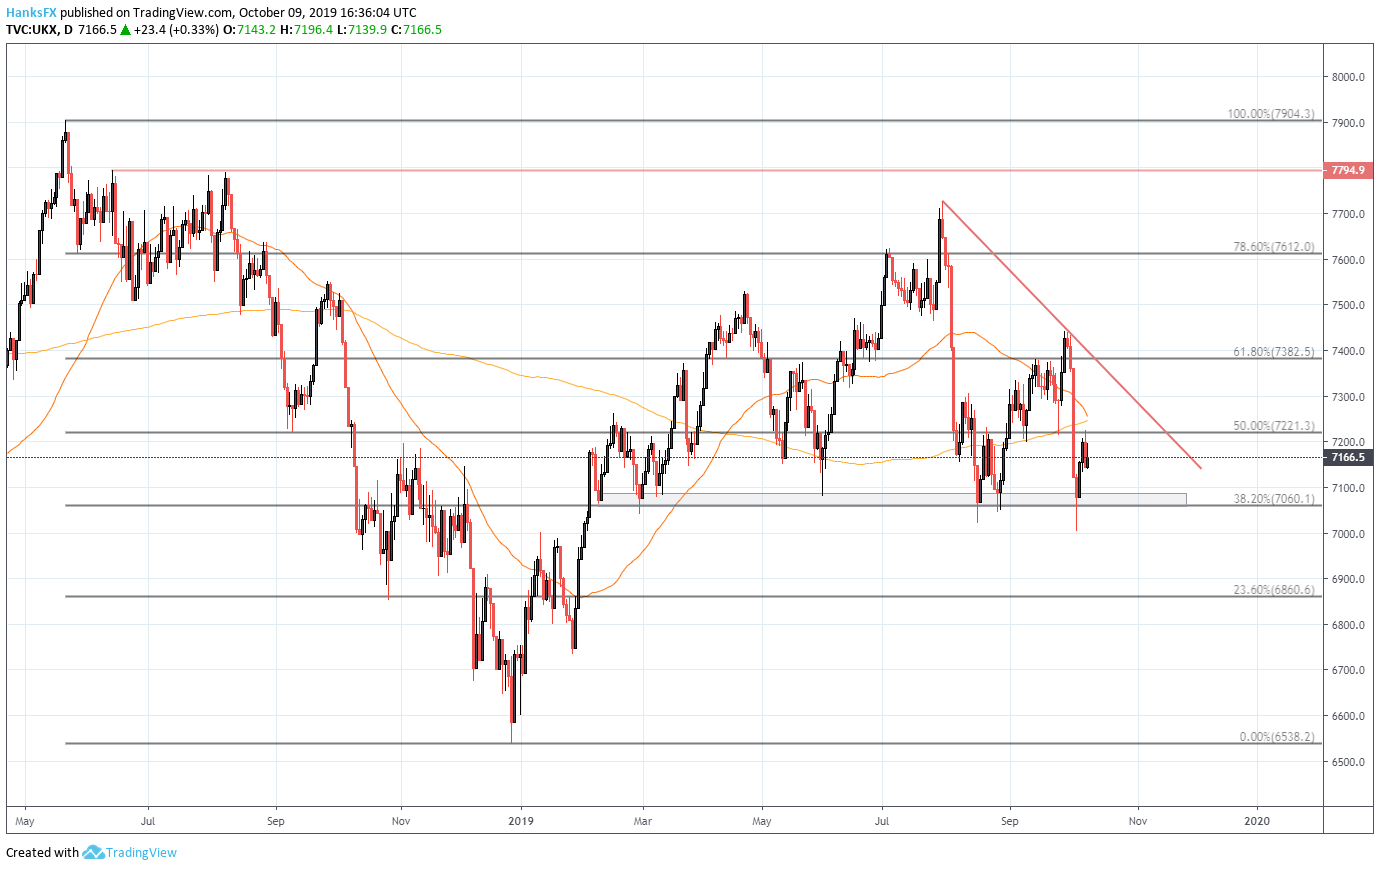
Chart created with TradingView
With that said, the Index should be watched closely for further signs of weakness. If the FTSE 100 is unable to correct its path higher, the break beneath the 200-day moving average could see pressure mount and threaten longstanding support around 7060. Should the area fail to buoy price, subsequent support around 6860 could mark the next level where the Index will look to level off initially.
CAC 40 Forecast
Unlike the FTSE which has had to negotiate the perils of Brexit, the CAC 40 has enjoyed an encouraging few months by comparison. Still, the Index’s 200-day moving average is fast approaching the shorter-term 50-day which could see the CAC 40 join the likes of the Russell 2000 and FTSE 100. Therefore, support around 5424 presents an opportunity for the Index to stave of a death cross.
CAC 40 Price Chart: Daily Time Frame (October 2017 – October 2019) (Chart 2)

Chart created with TradingView
If it is discarded, an ascending trendline from December and June lows could look to work in conjunction with the 200-day moving average itself to provide secondary support. A breach of both these levels could see the Index quickly test the 61.8% Fibonacci at 5239, before looking to prior swing lows around 5175.
--Written by Peter Hanks, Junior Analyst for DailyFX.com
Contact and follow Peter on Twitter @PeterHanksFX
Read more: Stock Market Q4 Forecast: The Weight of Trade Wars May Finally Crack the Dow Jones


