


Dow Jones & DAX 30 Forecasts:
- The Dow Jones trades between the 50 and 200-day moving averages as the two levels threaten convergence
- The DAX 30 clings to 12000, just 1.7% away from the 200-day moving average around 11800
- Day Trading the Dow Jones: Strategies, Tips & Trading Signals
Dow Jones & DAX 30 Forecasts: Indices Show Signs of Vulnerability
The Dow Jones slid lower on Tuesday, damaged by a deterioration in US-China trade talks following an announcement by the Chinese Commerce Ministry. Consequently, the likelihood of a trade deal has diminished and was undercut further when the United States announced it would add another 28 Chinese companies to the entity list. The decision marks yet another instance in the US-China trade war where the two sides have traded immaterial improvements and empty optimism for concrete escalations.
The previous instance of material escalation was on August 23 when President Trump announced the entirety of tariffed goods would be subject to a 5% increase, resulting in a 30% tariff on $250 billion in goods and a 15% tariff on $300 billion in goods – scheduled to go into effect on October 1 and December 15 respectively. The tariffs effectively cover the totality of Chinese exports to the United States. At the time, some market participants viewed the decision as mere posturing ahead of the October trade talks as each side looked to gain ammunition for the negotiating table.
Download our Free Quarterly Forecasts for the Dow Jones, DAX 30, US Dollar, Gold and more.
Now, the trade talks have arrived, higher tariffs are in place, and the United States just added another list of Chinese companies that are barred from buying US technology. Despite the substantial increase in levies and blacklisted companies, the Dow Jones has climbed 1.3% since August 26 – enjoying the benefit of a Fed rate cut in September. Still, it begs the question: to what degree has the escalation been priced into the market versus the unfounded optimism?
I would argue the market has underestimated the impact of the higher levies, and given October’s penchant for volatility, the Dow Jones could be positioned for a period of contraction. In turn, the resultant price action could see the Industrial Average test the 200-day moving average which has helped to keep price afloat since early 2018.
Dow Jones Price Chart: Daily Time Frame (January 2018 – October 2019) (Chart 1)
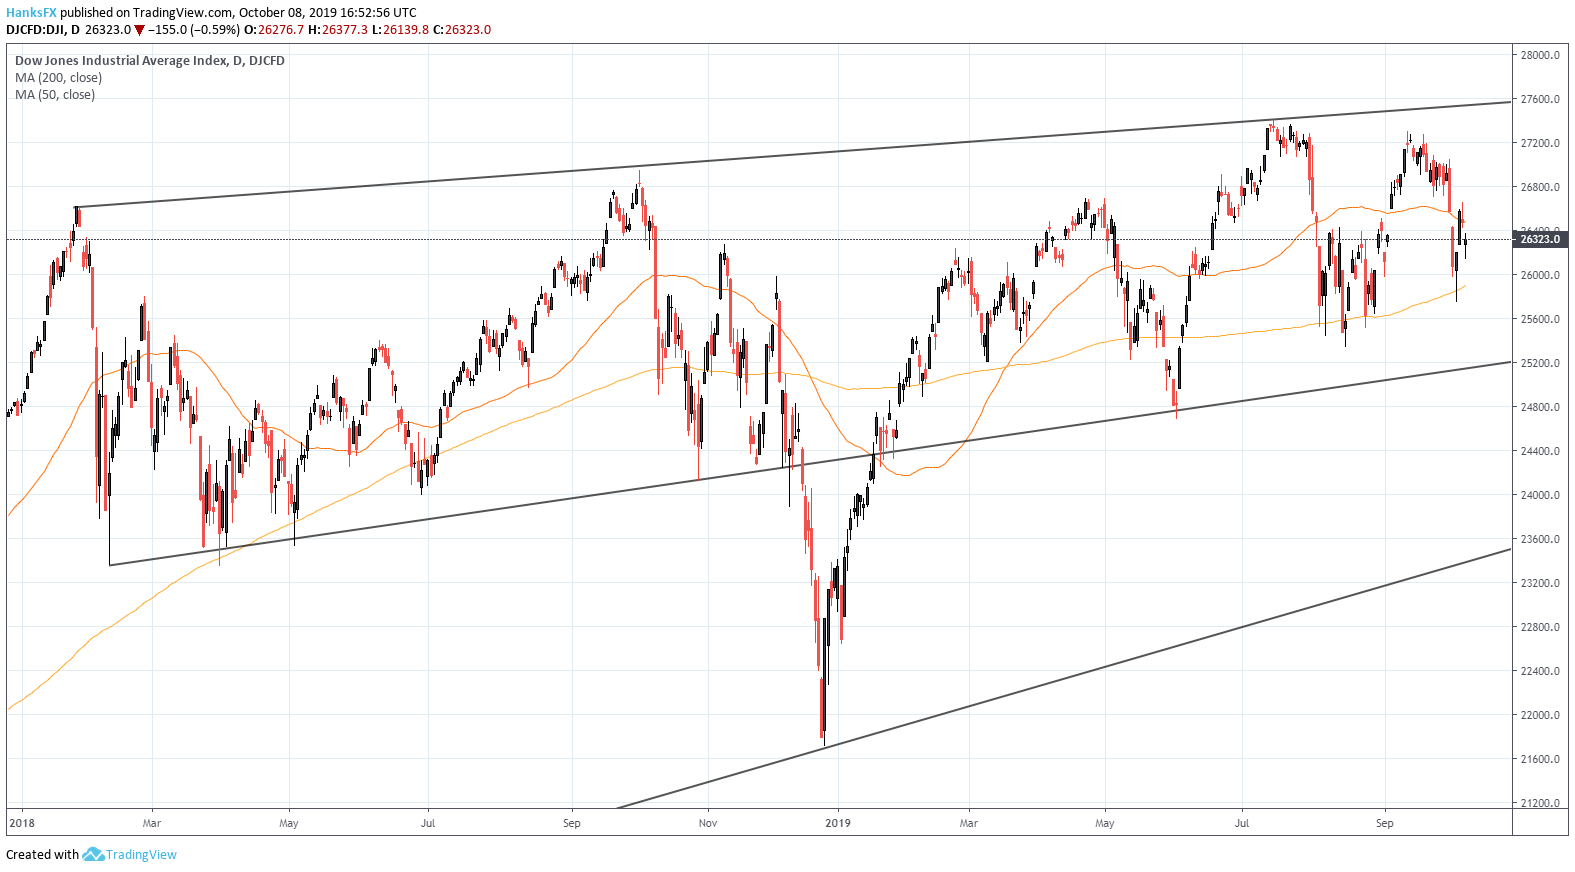
Chart created with TradingView
Currently residing around 25900, the DJIA trades approximately 300 points higher – meaning a daily decline of just 1.5% could see the Index reach the key level of support. If broken, the Index could look to test subsequent support – around 25200 – which is marked by the various swing lows throughout the last 20 months.
DAX 30 Forecast
The DAX 30 finds itself in a similar position. Given that it shares a statistically significant correlation with the Dow Jones, the German Index could become the victim of wider risk aversion. While the DAX 30 negotiates the adverse impact of a potentially weakened Dow, it will have to simultaneously ward off recession fears and a US-EU trade war that could decimate Europe’s largest economy.
DAX 30 Price Chart: Daily Time Frame (March 2017 – October 2019) (Chart 2)
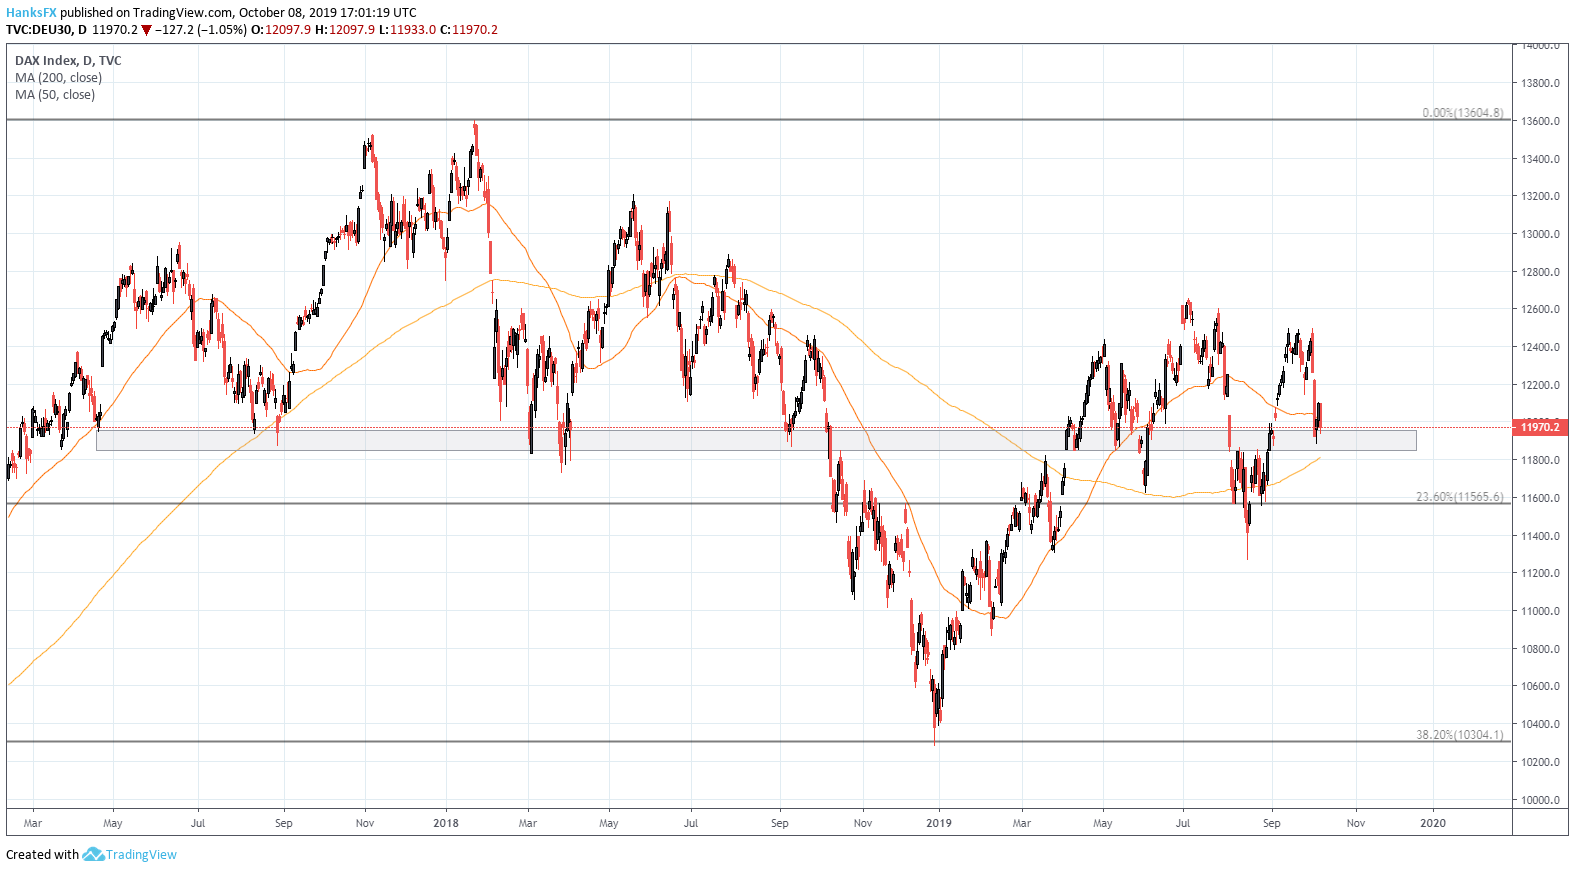
Chart created with TradingView
With that said, the country’s dismal manufacturing data has helped pressure the Index into close proximity with the 200-day moving average. Like the Dow Jones, the Index now threatens the formation of a death cross signal – a signal recently offered on the Russell 2000. Thus, while the situation in the United States equity market is precarious, the DAX’s may be direr. If support at 11800 fails, subsequent buoyancy may be offered by the Fibonacci level around 11565, before the door is opened to test August lows around 11275.
--Written by Peter Hanks, Junior Analyst for DailyFX.com
Contact and follow Peter on Twitter @PeterHanksFX
Read more: Stock Market Q4 Forecast: The Weight of Trade Wars May Finally Crack the Dow Jones


