


Gold (XAU) Price, Silver (XAG) Price Analysis and Chart
Q3 2019 Gold Forecast and Top Trading Opportunities
Gold Benefitting from a Risk On Backdrop
Gold’s recent correction lower after having printed a six-and-a-half-year high looks to have run its course and the precious metal may turn higher again. A risk-off backdrop has given gold a boost, while on the charts the metal is nearing bullish levels on the CCI indicator. The ongoing US-China trade spat shows no signs of easing, while US President Trump is also setting his cross-hairs on Europe and will likely act, especially with the Euro at such a low level. However, the strength of the US dollar is currently acting as a brake on any further upside, although bond yields continue to fade lower.
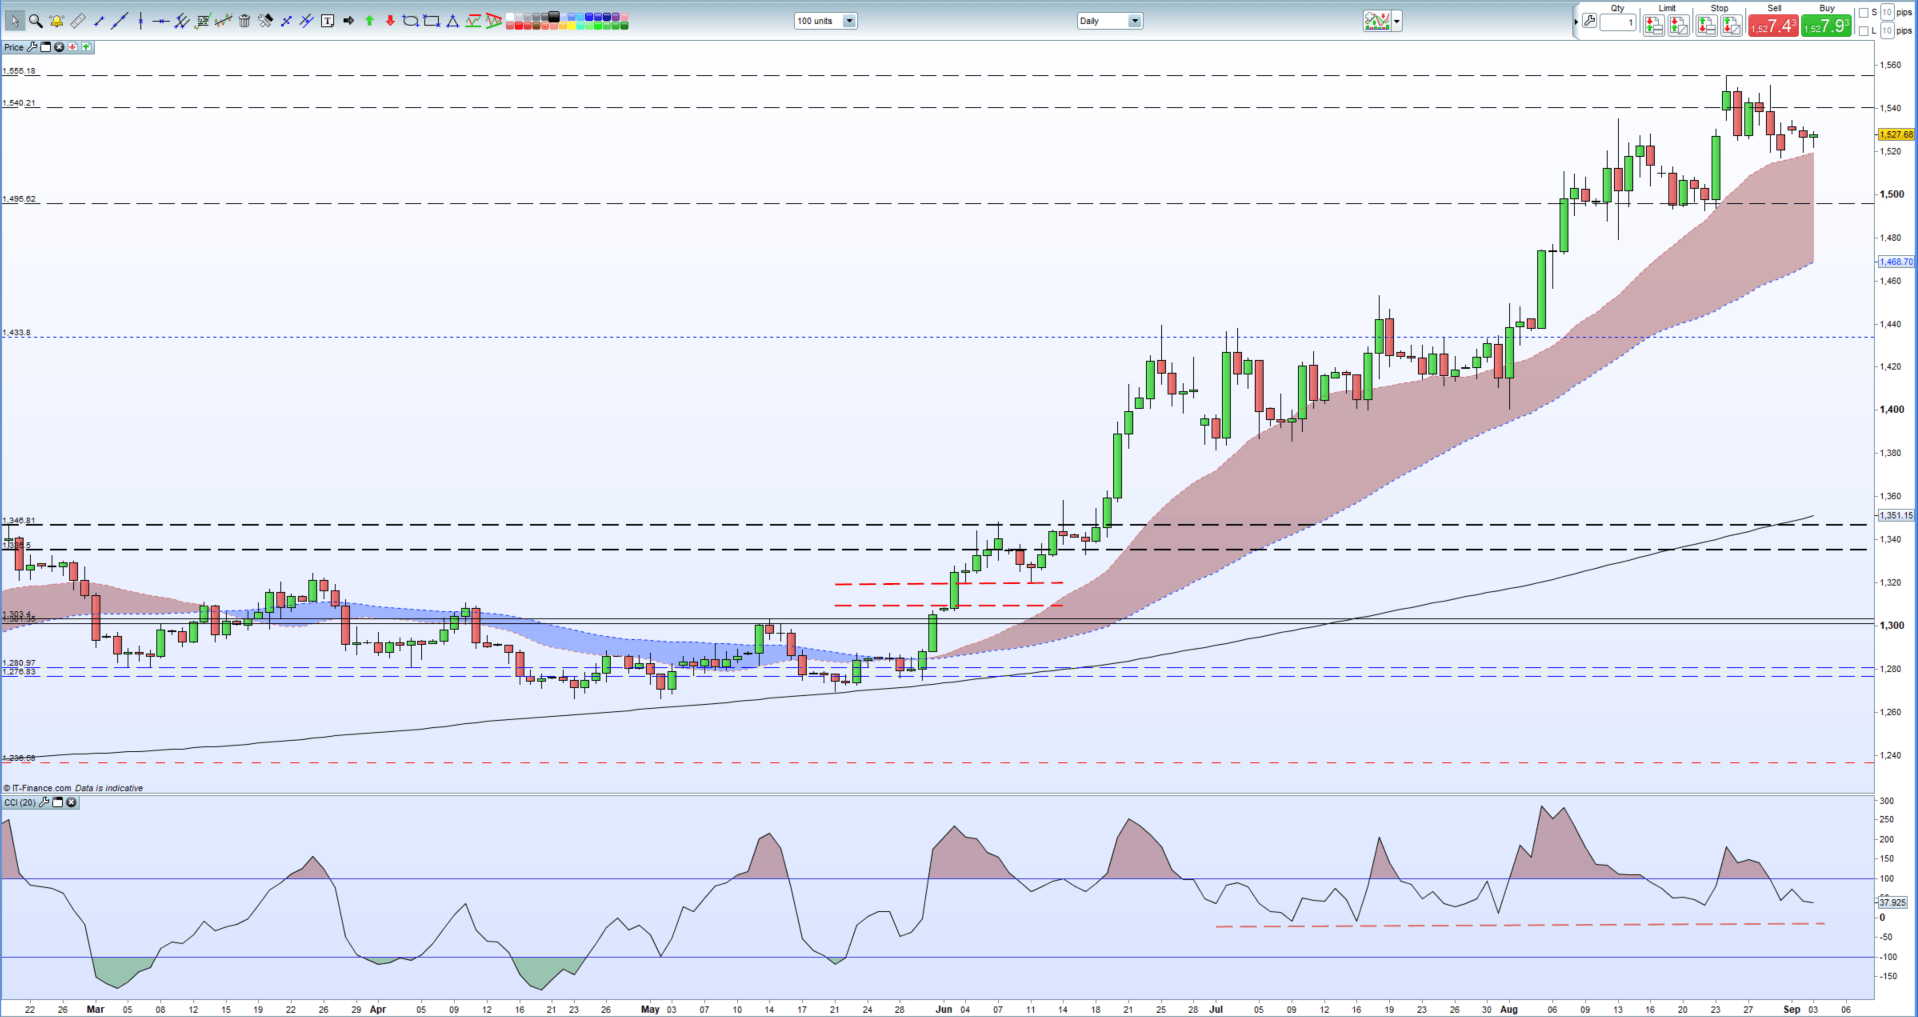
US Dollar Daily Chart (December 2018 – September 3, 2019)
Initial support for gold is the 20-day moving average at $1,520.00/oz. ahead of $1,517.00/ozbefore a layer of support levels between $1,492/oz. and $1,500.00/oz. cut in. To the upside, $1,535.00/oz before the recent multi-year high at $1,555.20/oz.
Gold Price Daily Chart (February – September 3, 2019)
IG Client Sentiment data show that 64.5% of retail traders are net-long of gold, a bearish contrarian indicator. However, recent daily and weekly positional changes give us a stronger bearish contrarian trading bias.
How to Trade Gold: Top Gold Trading Strategies and Tips
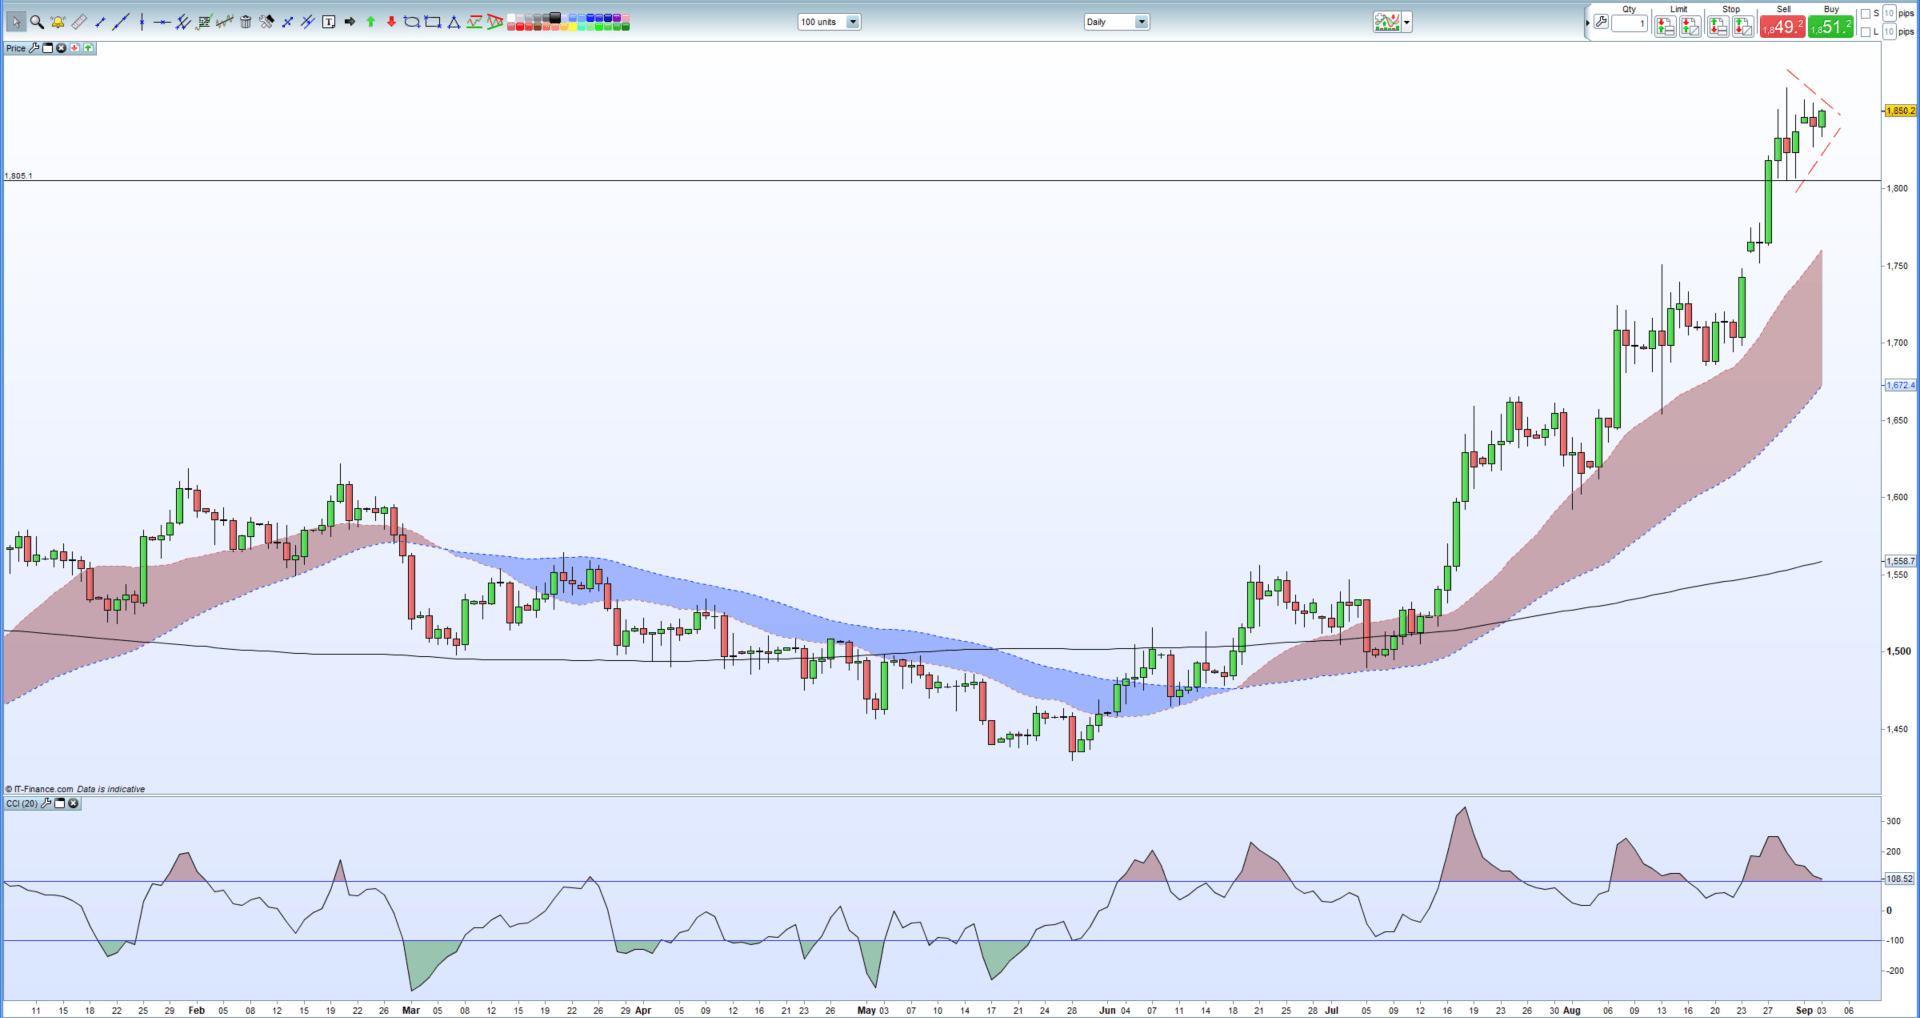
Silver Showing Signs of a Bullish Pennant Set-Up
Silver’s recent run up to multi-month highs has also slowed but recent price action suggests a bullish flag formation may be forming which, if completed, could see silver threatened the $20.00/oz. level ahead of the July 2016 high at just over $21.00/oz. All three moving averages remain supportive while the CCI indicator is drifting back out of overbought territory. There are recent support levels between $18.05/oz. and $18.35/oz. that should prove resilient.
The gold/silver ratio is currently 82.66.
Silver Daily Price Chart (February – September 3, 2019)
How to Trade Silver: Top Trading Strategies
Traders may be interested in two of our trading guides – Traits of Successful Traders and Top Trading Lessons – while technical analysts are likely to be interested in our latest Elliott Wave Guide.
What is your view on Gold and Silver – bullish or bearish?? You can let us know via the form at the end of this piece or you can contact the author at nicholas.cawley@ig.com or via Twitter @nickcawley1.


