


Nasdaq 100 Price Forecast:
- A huge gap higher on Monday allowed the Nasdaq 100 to surpass key resistance around 7,700
- Still, the tech-heavy Index enters the latter half of the week with significant open air beneath and if fundamental developments disappoint, the gaps could accelerate losses
- Interested in equities? Check out the DailyFX Podcast with Andrew Milligan, head of global strategy at Aberdeen Standard Investments
Nasdaq 100 Forecast: Index Retakes September Peaks but Gaps Loom
After a hearty gap higher on Monday, the Nasdaq 100 retook the 7,700 level which marks prior peaks in September 2018. A brief retracement on Tuesday threatened those gains, but outstanding earnings from Target and Lowe’s allowed it to retain them in Wednesday trading. That said, Monday’s gap leaves significant unfilled space beneath current levels and with an economic calendar packed with fundamental event risk, those gaps could look to accelerate losses if monetary policy remarks miss the market’s lofty expectations.
Nasdaq 100 Price Chart: Daily Time Frame (December 2018 – August 2019) (Chart 1)
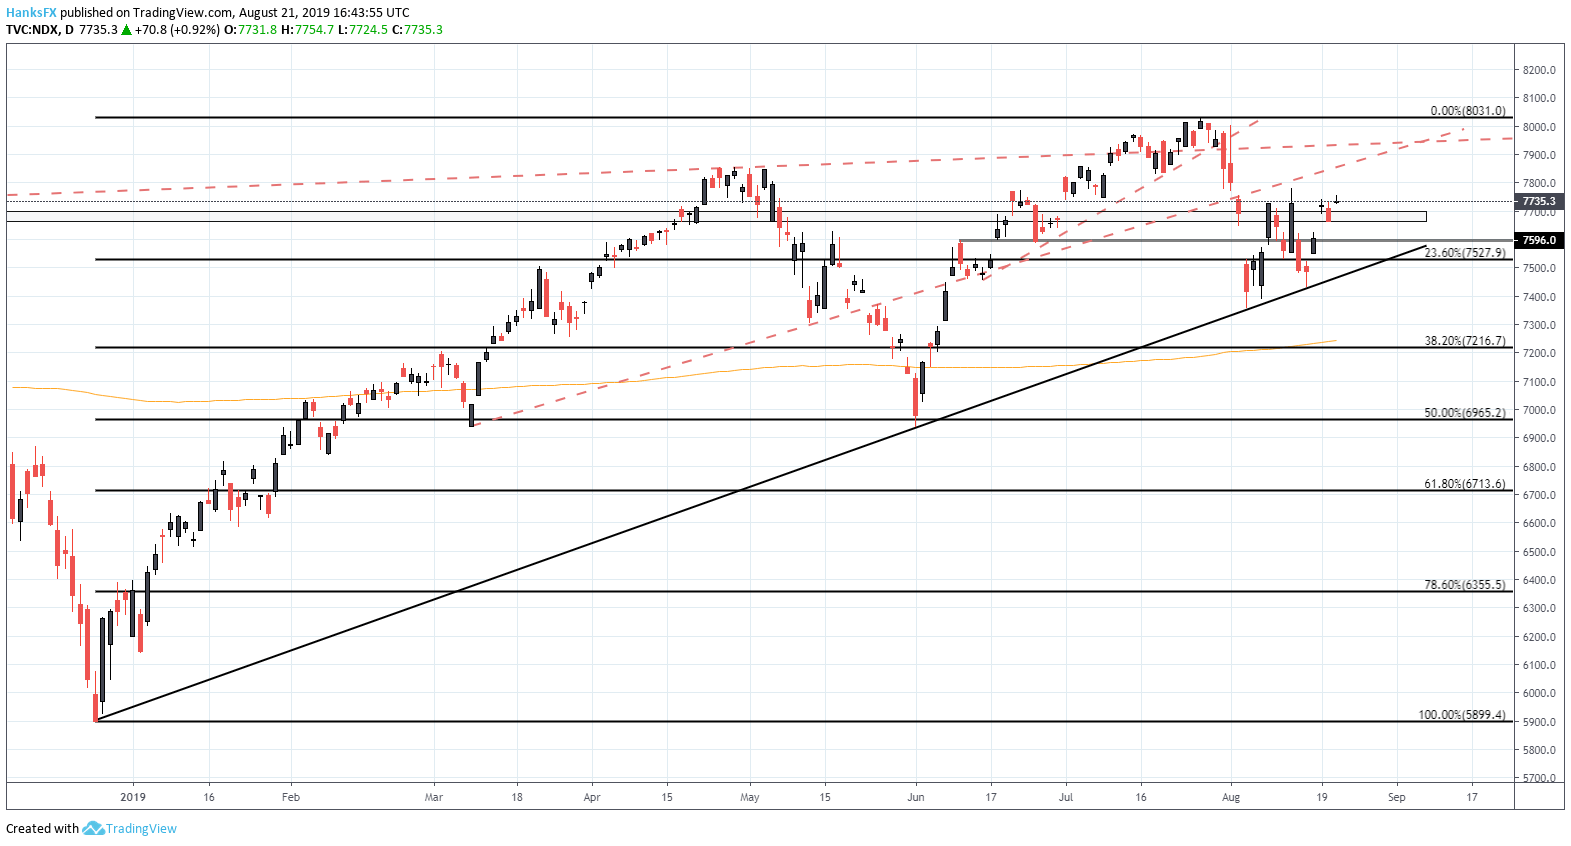
Chart created with TradingView
Therefore, 7,700 will be the initial level to watch for support if bearishness takes hold. Should the support give way, traders could look to fill the gap beneath which could see the Nasdaq quickly slip to 7,623 where minor support may assist bulls around 7,596. Slightly lower still, a confluence of support will look to rebuke bears around the 7,527 where a Fibonacci level intersects the ascending trendline from December.
Sign up for our Free Weekly Equity Webinar in which critical technical levels and fundamental themes are analyzed each week.
If, on the other hand, the July FOMC minutes or the Jackson Hole Symposium offer a positive surprise regarding the outlook of monetary policy, traders will likely use the remarks as fuel for a continuation higher. Initial resistance of note should be offered by the ascending trendline from March. While it has been broken numerous times, a gap beneath in early August suggests the area still holds some influence. A continuation higher will first need to overcome the level before it can target subsequent resistance around 7,935 and eventually all-time highs slightly above 8,000.
Nasdaq 100 Price Chart: 4 – Hour Time Frame (March – August) (Chart 2)
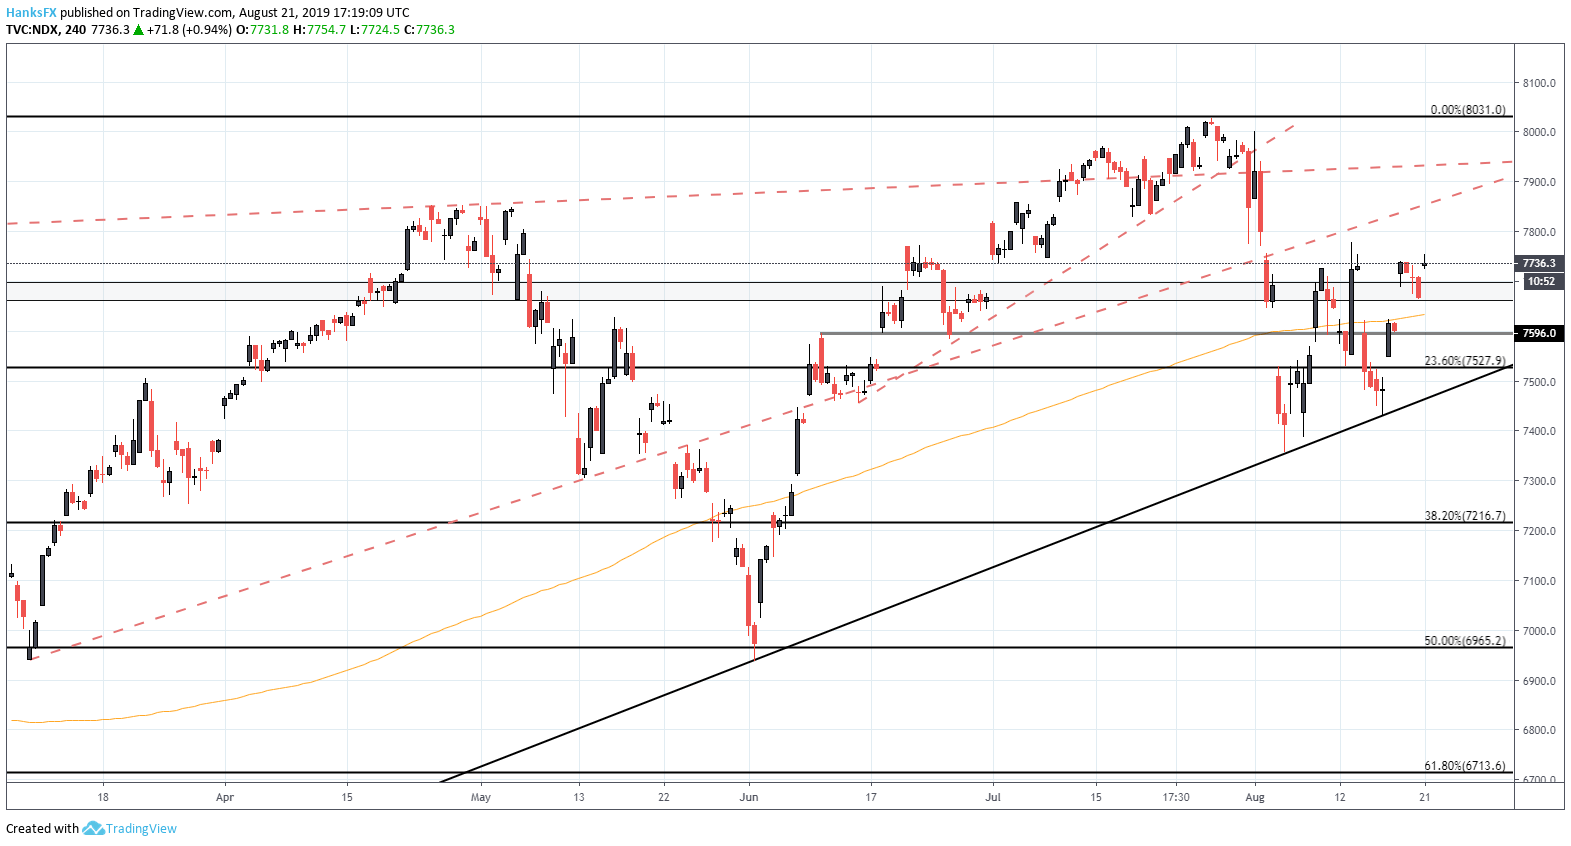
Chart created with TradingView
With the technical landscape laid out, traders should now look to the FOMC minutes and Jackson Hole Symposium for catalysts. While each event possesses potential to spark a bullish continuation, long upper wicks and short lower wicks over the last three days could speak to deteriorating demand. Consequently, if the fundamental events are devoid of a bullish surprise, it could translate to near-term bearishness even if the events lack explcit hawkishness. For more technical analysis and fundamental updates on the major equity markets, follow @PeterHanksFX on Twitter.
--Written by Peter Hanks, Junior Analyst for DailyFX.com
Contact and follow Peter on Twitter @PeterHanksFX
Read more: Canadian Dollar Price Forecast: USD/CAD Strength May Fade


