


Dow Jones Today:
- Home Depot (HD) stock surged on Tuesday as earnings came in above expectations
- Competitor Lowe’s (LOW) and Target (TGT) will provide a different angle on the consumer staple and consumer discretionary spaces compared to their larger competitors
- Sign up for our Free Weekly Equity Webinar in which critical technical levels and fundamental themes are analyzed each week
Dow Jones Forecast: TGT, LOW Earnings Expected to Highlight Trade Wars
Despite robust earnings from Home Depot, the Dow Jones succumbed to pressure on Tuesday as Wall Street negotiated yield curve jitters and trade war uncertainty which Home Depot contributed to after the company outlined headwinds from the conflict. Still, Home Depot marks the second large retailer - alongside Walmart (WMT) – in two weeks to offer trade war concerns but beat earnings expectations. Smaller than their two counterparts that have already reported, Target and Lowe’s will look to ride the coattails of their industry leaders when they release their quarterly findings on Wednesday.
Dow Jones Stock Price Chart: Daily Time Frame (2018 – August 2019) (Chart 1)
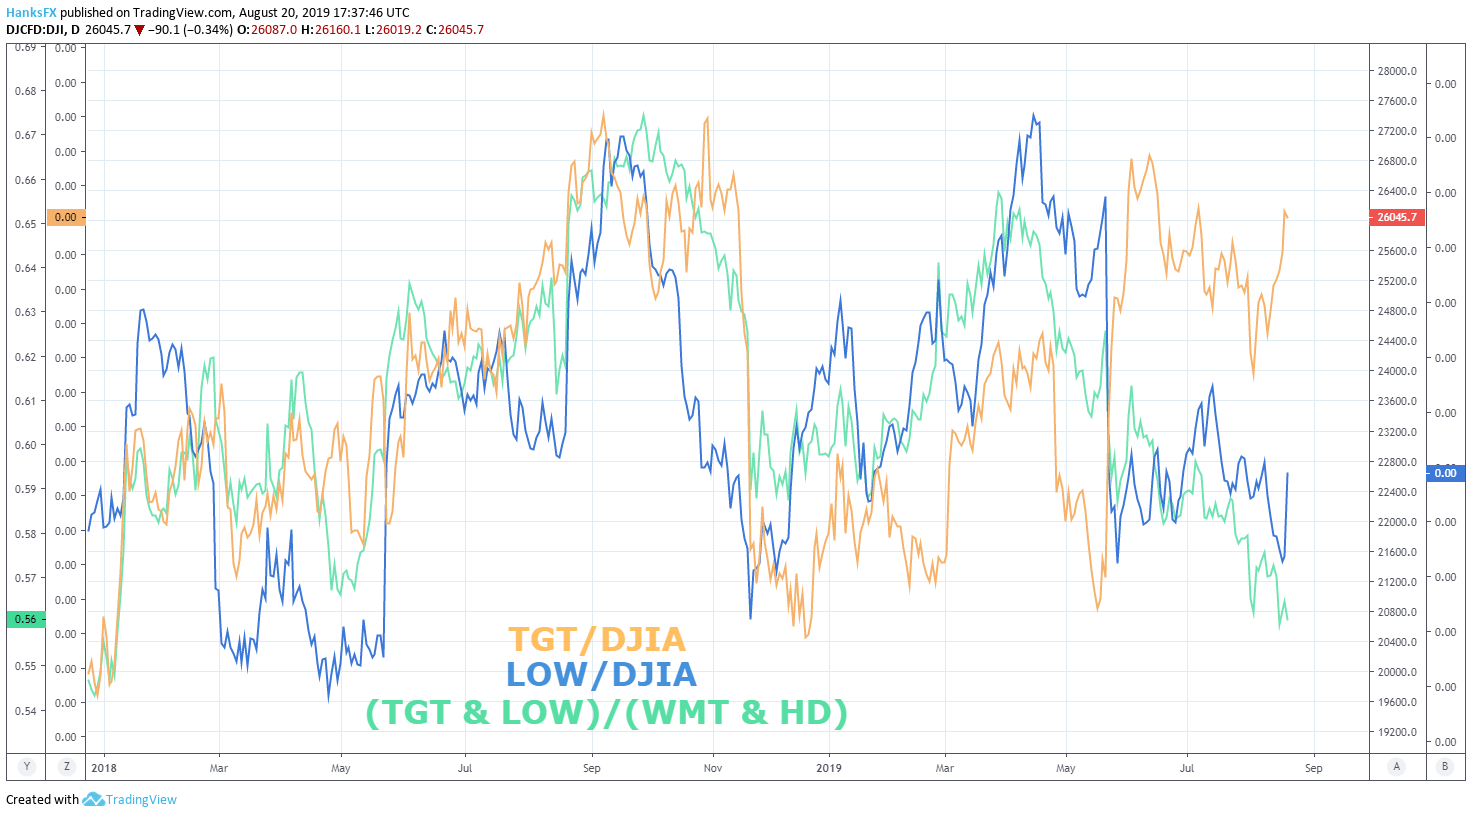
Chart created with TradingView
Sheer size and scope may have helped insulate WMT and HD from the trade war headwinds for the time being as they look to other areas of their supply chains and can more easily bear the brunt of slightly lower margins due to higher volume. In the case of Target which is known to offer the premium product when compared to Walmart, a hit to the company’s margins may see it lower revenue forecasts. Regardless, both Target and Lowe’s are expected to experience nearly double the earnings derived price volatility compared to their competitors.
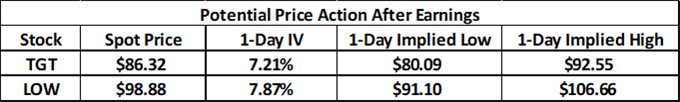
Data source: Bloomberg
Looking to Target specifically, past price action reveals the stock seems unusually susceptible to large gaps. That said, the absolute average price move on earnings in the last 12 quarters has been noteworthy at 6.37% - slightly below the implied move for Wednesday.
Resistance, support and the stock’s all-time high exist within the implied price range, which might contribute to intraday volatility post-earnings. Although the range enjoys an abundance of technical levels, I am hesitant to suggest any posses the influence to singlehandedly stall post-earnings movement but potential support may reside around $80 which coincides with the lower bound of the implied range.
Target (TGT) Stock Price Chart: Daily Time Frame (August 2018 – August 2019) (Chart 2)

Chart created with TradingView
On the other hand, Wednesday’s earnings could be make or break for Lowe’s. In the year-to-date, the stock is just 6% higher compared to Home Depot’s 26% return and the Dow’s 14.5% gain. Another disappointing quarter could see LOW shares venture beneath the double-bottom from May and August and break beneath the ascending trendline originating from August 2017.
Lowe’s (LOW) Stock Price Chart: Daily Time Frame (July 2017 – August 2019) (Chart 3)
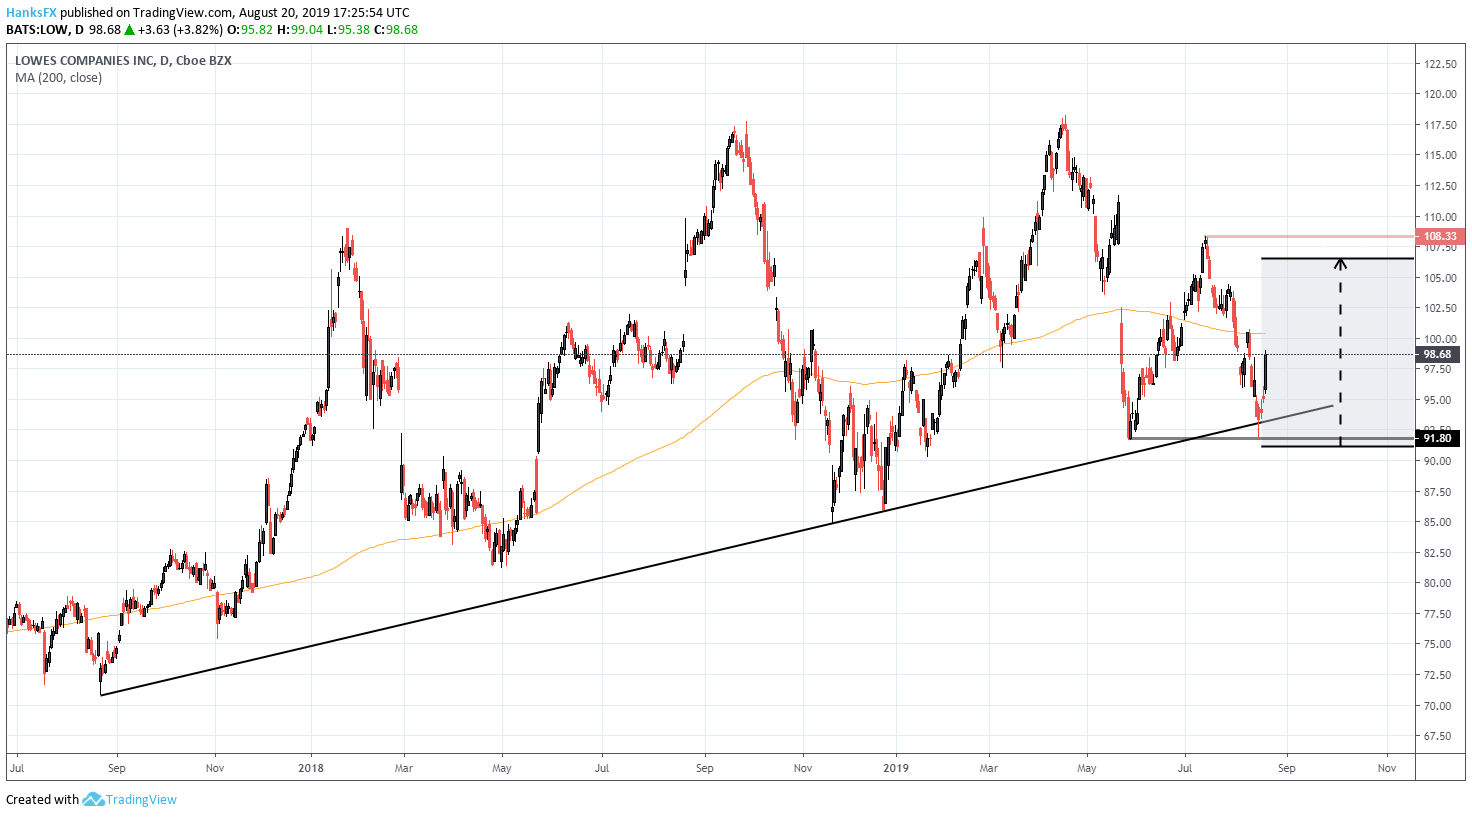
Chart created with TradingView
Critically, the trendline is within the implied price range which extends to $91.80 which coincidentally marks the stock’s 2019 opening price. A journey to this level would leave it flat for the year, thus making it a serious laggard in the year-to-date.
If Lowe’s follows in Home Depot’s footsteps and delivers robust quarterly results, $105 may look to stall a move higher as it marks previous areas of minor price indecision and is near the top of the implied range. For more technical analysis and fundamental updates on the major equity markets, follow @PeterHanksFX on Twitter.
--Written by Peter Hanks, Junior Analyst for DailyFX.com
Contact and follow Peter on Twitter @PeterHanksFX
Read more: Dow Jones, DAX 30, FTSE 100, Nasdaq 100 Technical Forecasts


