


Crude Oil Price, Analysis and Chart:
Q3 2019 Goldand Oil Forecasts and Top Trading Opportunities
The DailyFX Calendar covers all important market moving data releases and events.
Crude Oil Hits a Seven-Month Low - More to Come?
Oil is weak and is likely to remain that way in the short- to medium-term as trade wars and global growth concerns continue to press down on the market. After US President Trump put an additional 10% tariff on USD300 billion of Chinese imports, the PBoC let USDCNH break above 7.00, drawing the ire of President Trump who labelled China a ‘currency manipulator’ – a charge China strongly denied. With neither side backing down, and with US President Trump likely to hike recent tariff levels, the trade war situation is expected to get worse before it gets better.
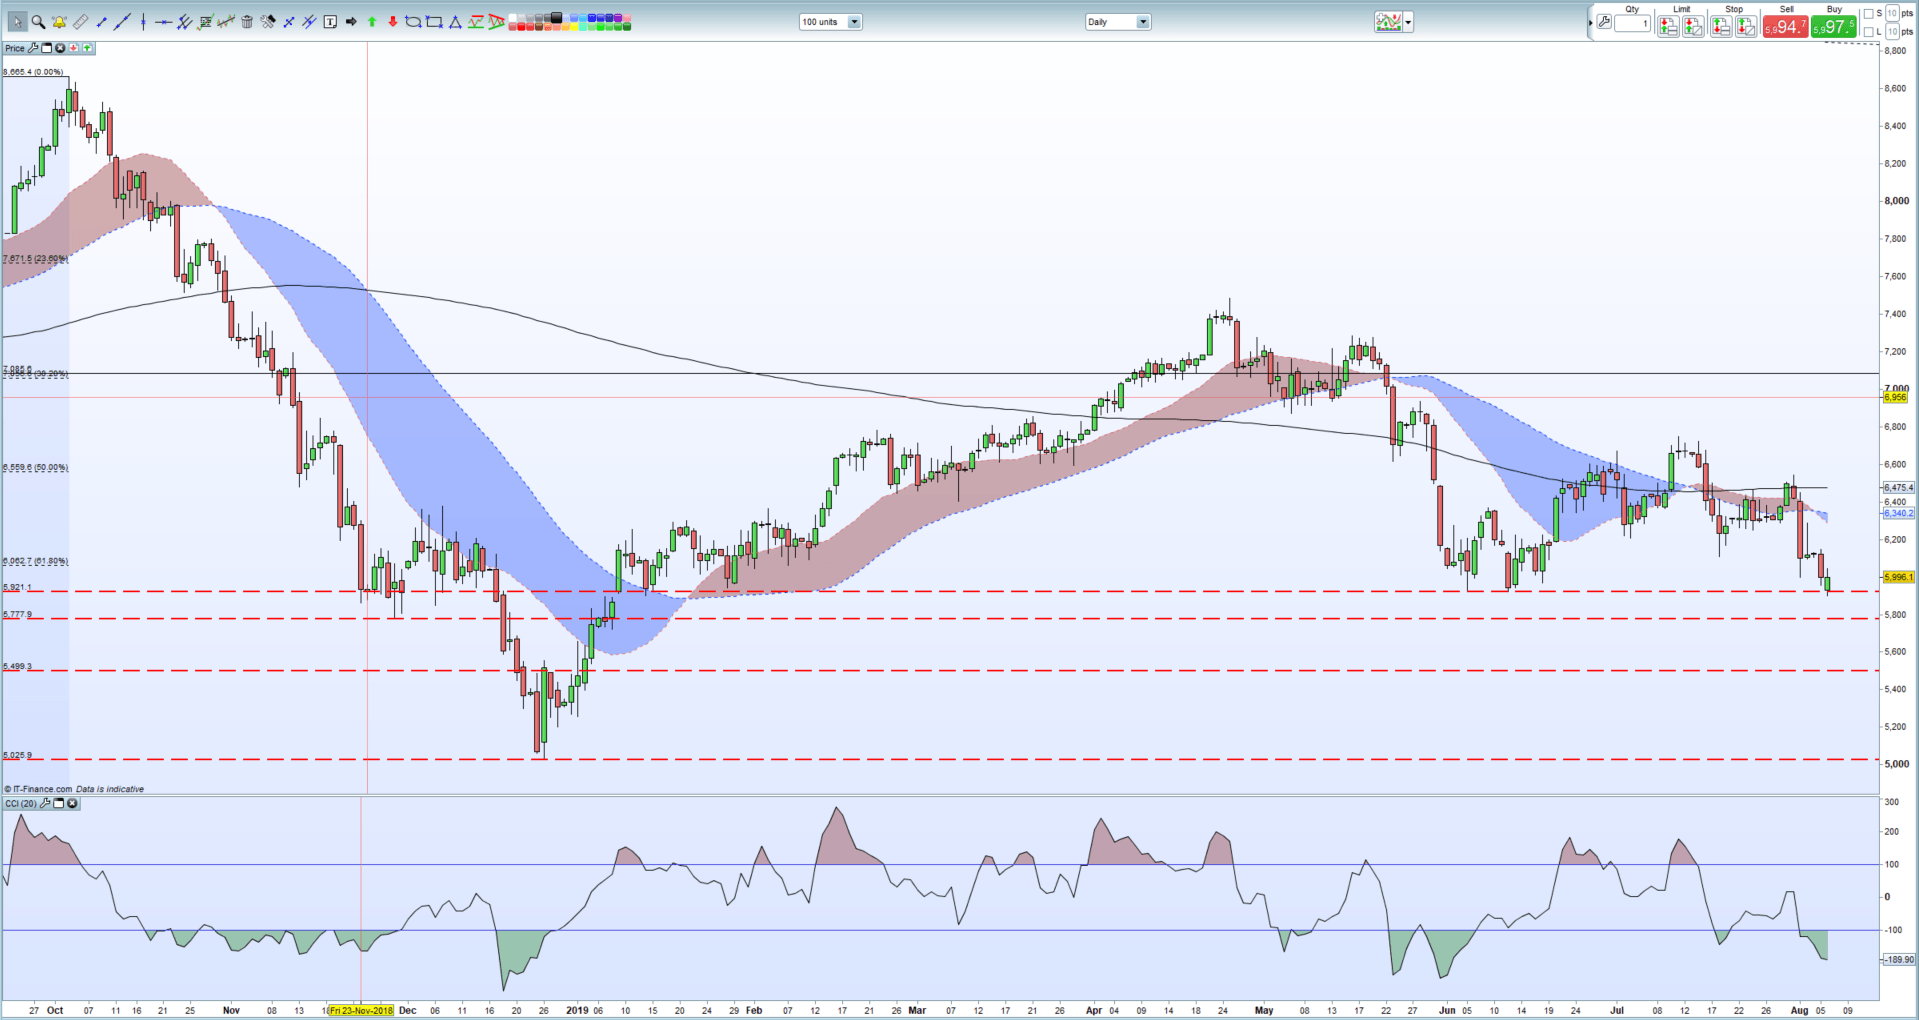
Brent crude hit a seven-month low early Tuesday around $59.00/bbl. before staging a mini-bounce back to $60.00/bbl. This move looks unconvincing and a further break, and close below, the $59.21/bbl. level will open the way for bears to attack the November 2018 swing-low at $57.78/bbl. before targeting the December 26, 2018 low at $50.25/bbl.Oil remains below all three moving averages and the 61.8% Fibonacci retracement level at $60.62/bbl. but is in oversold territory which may slow down any further sell-off.
How to Trade Oil: Crude Oil Trading Strategies & Tips
200-Day Moving Average: What it is and How it Works.
Crude Oil Daily Price Chart (October – August 6, 2019)
Traders may be interested in two of our trading guides – Traits of Successful Traders and Top Trading Lessons – while technical analysts are likely to be interested in our latest Elliott Wave Guide.
What is your view on Oil – bullish or bearish?? You can let us know via the form at the end of this piece or you can contact the author at nicholas.cawley@ig.com or via Twitter @nickcawley1.


