


US-China Trade Tariffs, Crude Oil Price, Analysis and Chart:
- US President Trump ramps up trade tariffs.
- Oil breaks sharply lower on growth slowdown, demand fears.
Q3 2019 Goldand Oil Forecasts and Top Trading Opportunities
The DailyFX Calendar covers all important market moving data releases and events.
Crude Oil Turning Marginally Higher After Hitting a Six-Week Low
US President Donald Trump turned the pressure up on China in the ongoing trade dispute by announcing a new 10% tariff on the remaining $300 billion of Chinese imports, starting on September 1. The US currently impose a 25% tariff on $250 billion worth of Chinese imports. The latest tariff means that nearly all US imports of Chinese goods now have tariffs. China is expected to respond to the latest move, leaving the trade relations between the world’s two largest economies at a low ebb. Global trade and growth are slumping and this latest move by the US will increase fears of a prolonged economic slowdown. There is also talk that US President Trump is set to make an announcement later today about EU trade with possible auto-tariffs in the wings.
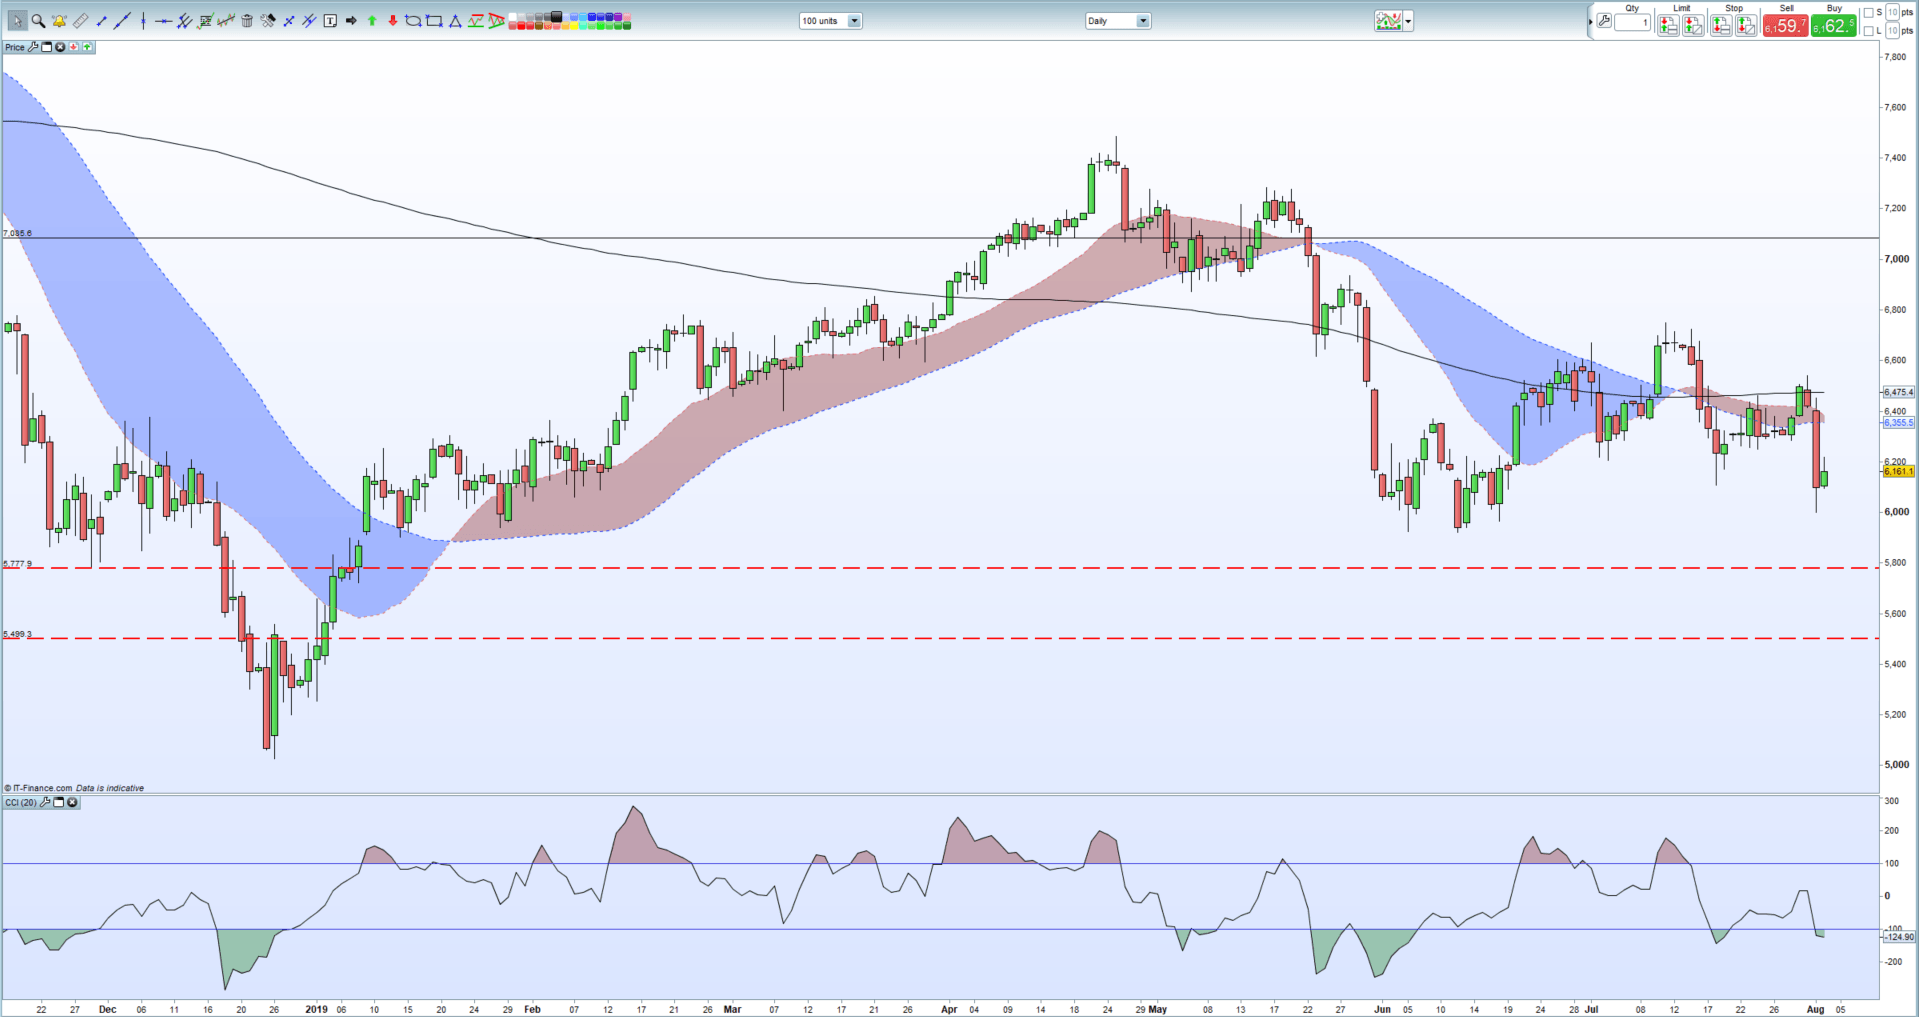
This ratcheting up of the US-China trade dispute sent oil back down to six-week lows with crude oil down nearly 8% on the day at one point. Oil has recovered marginally in early turnover, but Thursday’s sharp move lower has turned the chart negative. The 200-day moving average ($64.75/bbl.) is now acting as strong resistance ahead of the 50% Fibonacci retracement level at $65.60/bbl. To the downside, the psychological $60.00/bbl. level may offer initial support ahead of the June 5 multi-month low at $59.23/bbl.
How to Trade Oil: Crude Oil Trading Strategies & Tips
200-Day Moving Average: What it is and How it Works.
Crude Oil Daily Price Chart (December – August 2, 2019)
Traders may be interested in two of our trading guides – Traits of Successful Traders and Top Trading Lessons – while technical analysts are likely to be interested in our latest Elliott Wave Guide.
What is your view on Oil – bullish or bearish?? You can let us know via the form at the end of this piece or you can contact the author at nicholas.cawley@ig.com or via Twitter @nickcawley1.


