


Gold and Silver Prices, Analysis and Charts
- Gold chart highlights a ‘bull pennant’ formation.
- Silver stuck between two technical indicators.
- Gold and silver continue to diverge.
Q3 2019 Gold Forecast and Top Trading Opportunities
Gold Chart Looking Increasing Bullish
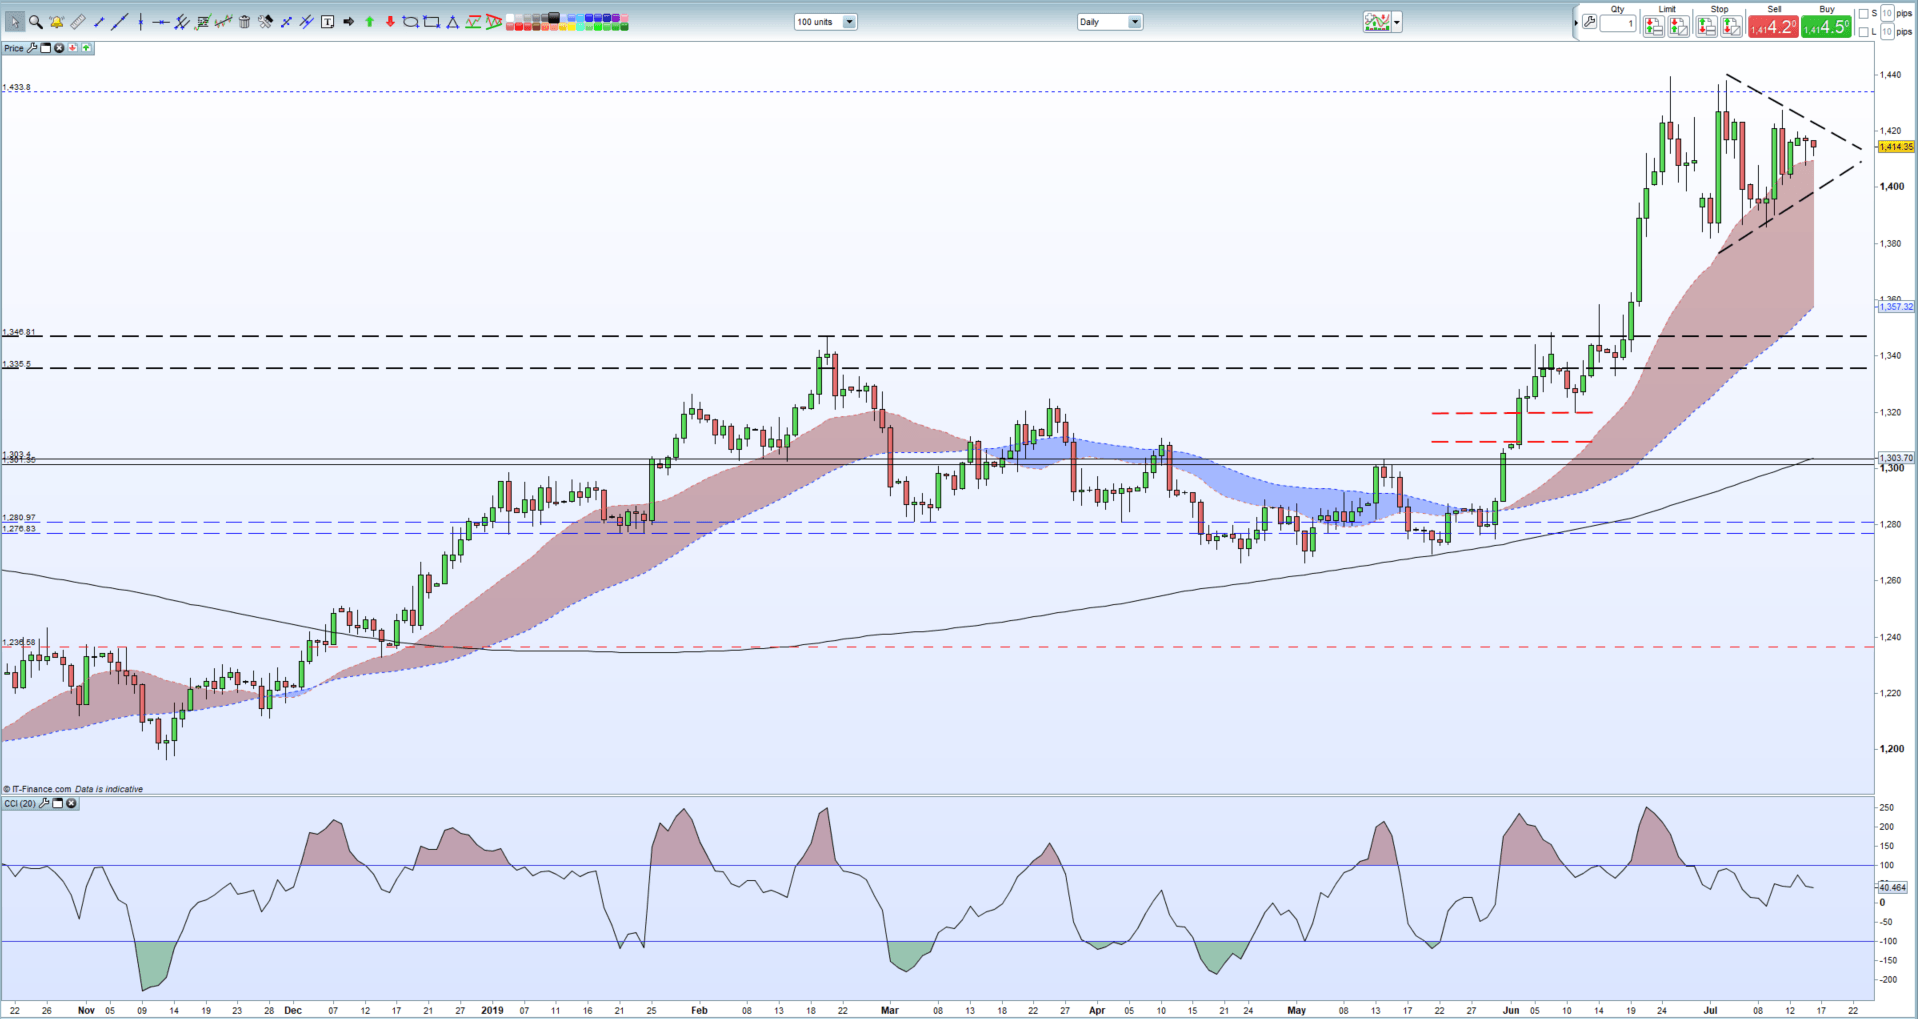
The daily gold chart shows a ‘bull pennant’ formation taking shape, with the current consolidation period expected to be followed by further upside movement for the precious metal. Any upside break of this pennant should see gold take out its recent six-year high around $1,440/oz. and head towards $1,500/oz. On the weekly chart there is a gap on the April 8, 2013 candle between $1,495/oz. and $1,540/oz. which bullish traders may look to fill.
How to Trade Gold: Top Gold Trading Strategies and Tips
Gold Price Daily Chart (October 2018 – July 16, 2019)
Silver Stuck and Struggling
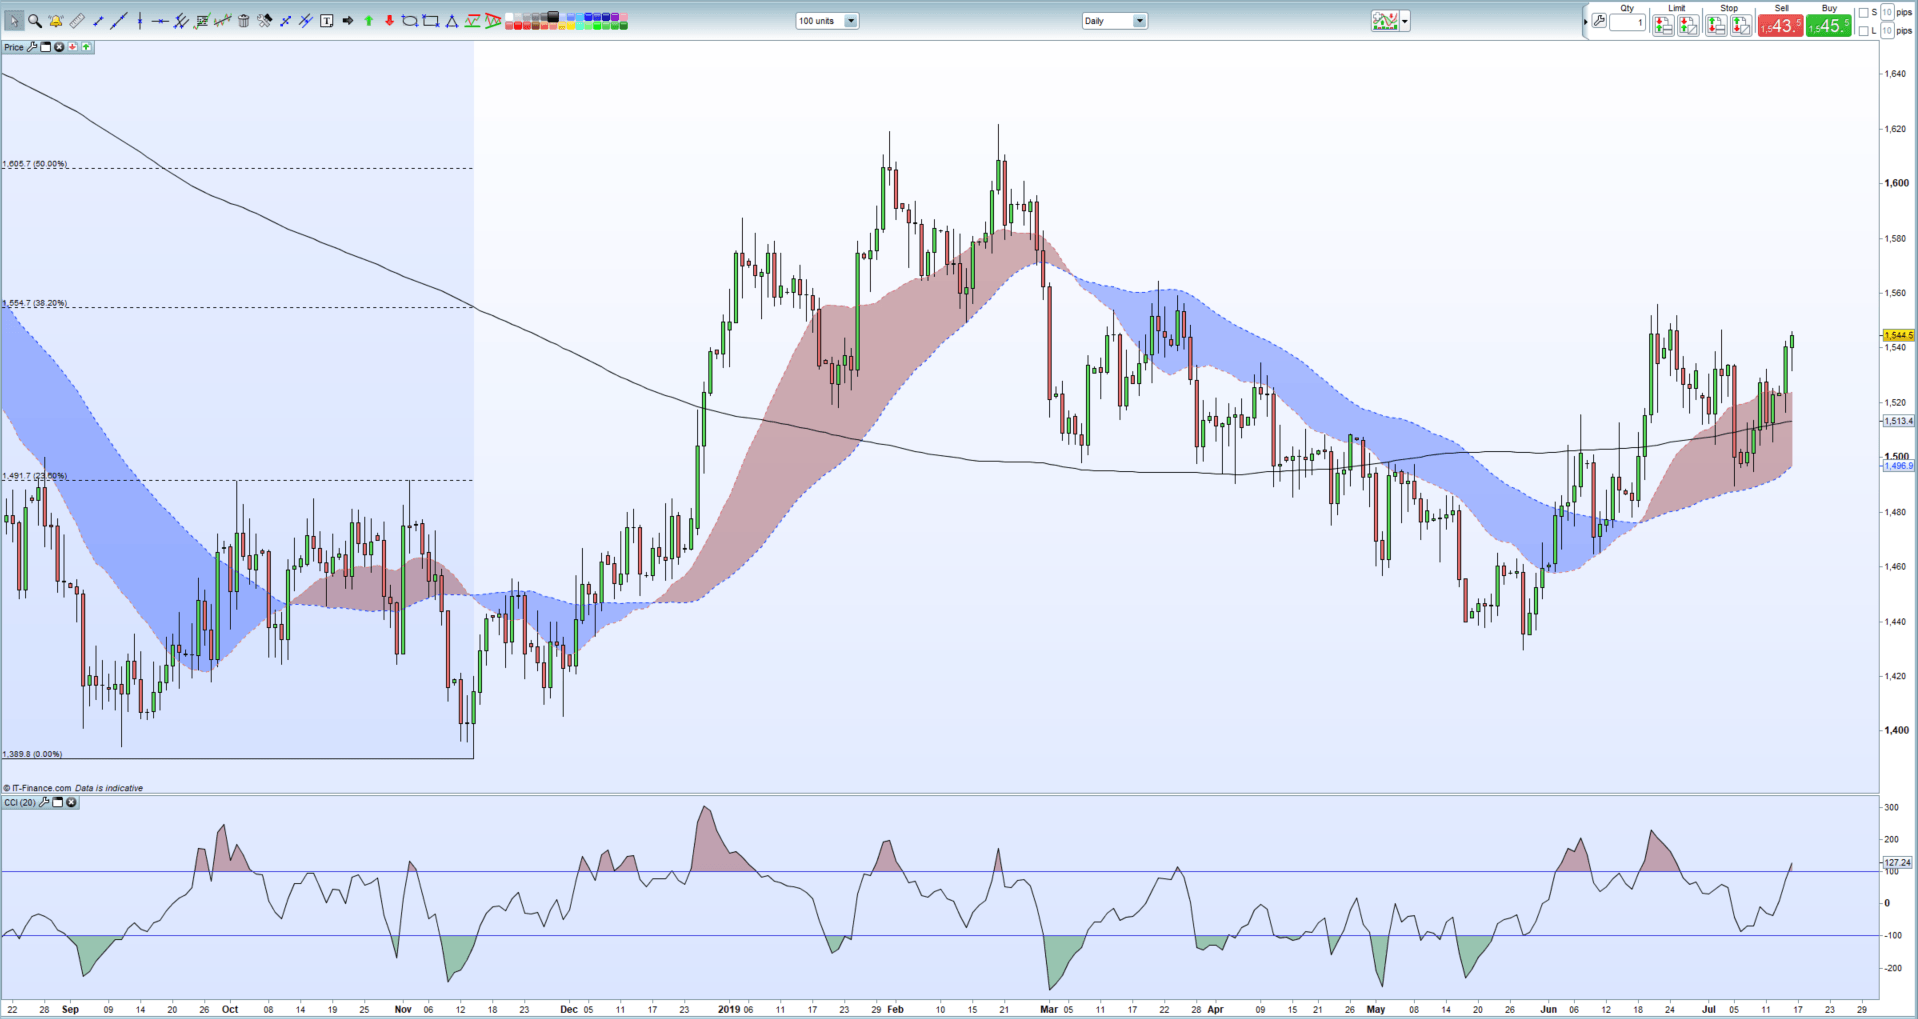
The recent break and close above the 200-day moving average has given silver a short-term boost but the metal remains capped by the 38.2% Fibonacci level at $15.54 and the recent multi-month high print just a couple of cents higher. Silver has also drifted into overbought territory and will need a fresh stimulus to keep the recent upside trend intact. The 200-day moving average at $15.13 should provide reasonably strong initial support.
How to Trade Silver: Top Silver Trading Strategies.
Silver Price Daily Chart (August 2018 – July 16, 2019)
Gold/Silver Spread Nears a 26-Year Wide
The closely watched gold/silver spread is now nearing levels last seen back in 1993 as gold continues to dominate the space. The February 1993 high around 93.25 is the near-term target and if broken and closed above would leave the all-time high at 100.28 made in February 1991 the next target.

Trading the Gold-Silver Ratio: Strategies and Tips
Traders may be interested in two of our trading guides – Traits of Successful Traders and Top Trading Lessons – while technical analysts are likely to be interested in our latest Elliott Wave Guide.
What is your view on Gold and Silver – bullish or bearish?? You can let us know via the form at the end of this piece or you can contact the author at nicholas.cawley@ig.com or via Twitter @nickcawley1.


