


Stock Market Outlook:
- Citigroup (C) delivered results slightly above market expectations, but the beat did not translate into gains for the S&P 500 which ended flat
- On Tuesday, Goldman Sachs (GS), Wells Fargo (WFC), JP Morgan (JPM) and Johnson & Johnson (JNJ) are slated to report before market open
- Market participants will look for any commentary regarding profit forecasts amid a looser monetary policy environment
Stock Market Outlook: Earnings Season Begins with a Beat
Earnings season began with a beat after Citigroup (C) boasted results above market expectations. Despite beating on both top and bottom lines, C shares traded lower early in the session to eventually close marginally lower than they opened. Similarly, the earnings did little to boost the S&P 500 which closed the session flat compared to a slight gain for the Dow Jones (+0.10%) and the Nasdaq 100 (+0.30%). That said, a string of heavy-hitters due to report before Tuesday’s open may stoke stock market volatility.
Stock Market Earnings to Watch
Goldman Sachs (GS)
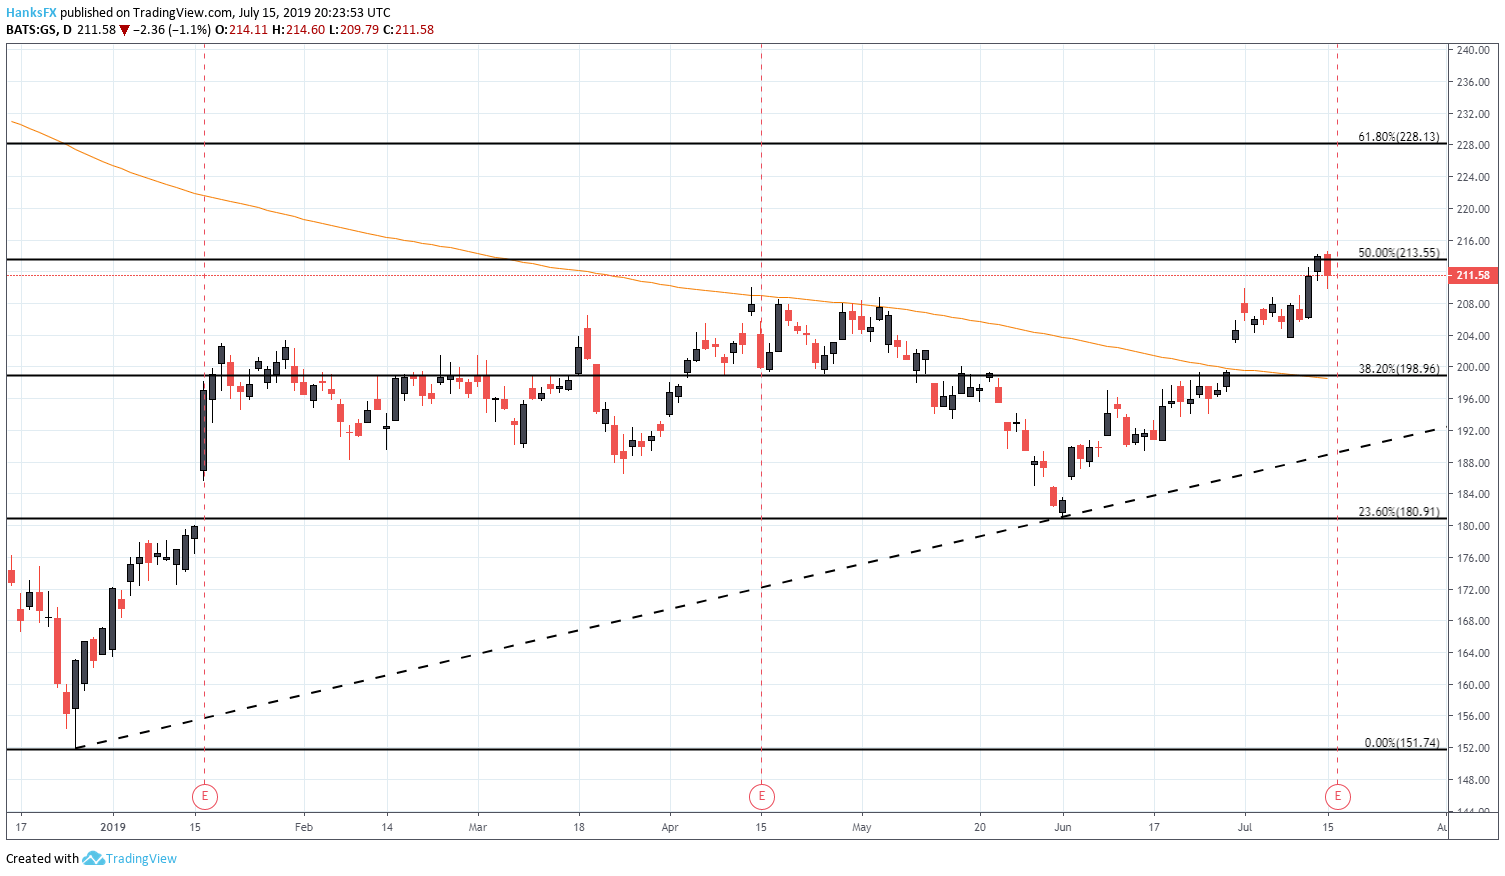
Goldman Sachs is one of the big-banks slated to report on Tuesday morning and GS shares currently trade between two nearby technical levels. To the topside, a 50% Fibonacci retracement around $213.5 will look to resist any attempts higher while minor support around $208 will hope to stall bearish reversals. Beneath $208, immediate support is lacking and if the initial level fails to hold, price could quickly target the $200 level with the 200-day moving average nearby.
Goldman Sachs (GS) Price Chart: Daily Time Frame (January – July) (Chart 1)
Wells Fargo (WFC)
Wells Fargo will release their results and remains one of the more-troubled large US banks. After a series of scandals and regulatory run-ins, WFC shares have been pressured over the last few years and the stock is the only one on our list beneath its 200-day moving average. With that in mind, a strong report could be met with jubilation as it would mark a step in the right direction for a troubled share price.
Wells Fargo (WFC) Price Chart: Daily Time Frame (December – July) (Chart 2)

Minor technical resistance sits atop Monday’s closing price around $47 but is unlikely to completely stall a bullish move on the back of positive earnings. Consequently, subsequent resistance around $48.50 will be the topside area to watch. As for support, WFC is lacking clear cut levels as the stock has been unable to mount a consistent trend. Nonetheless, the $45 area may look to provide some semblance of buoyancy.
JP Morgan (JPM)
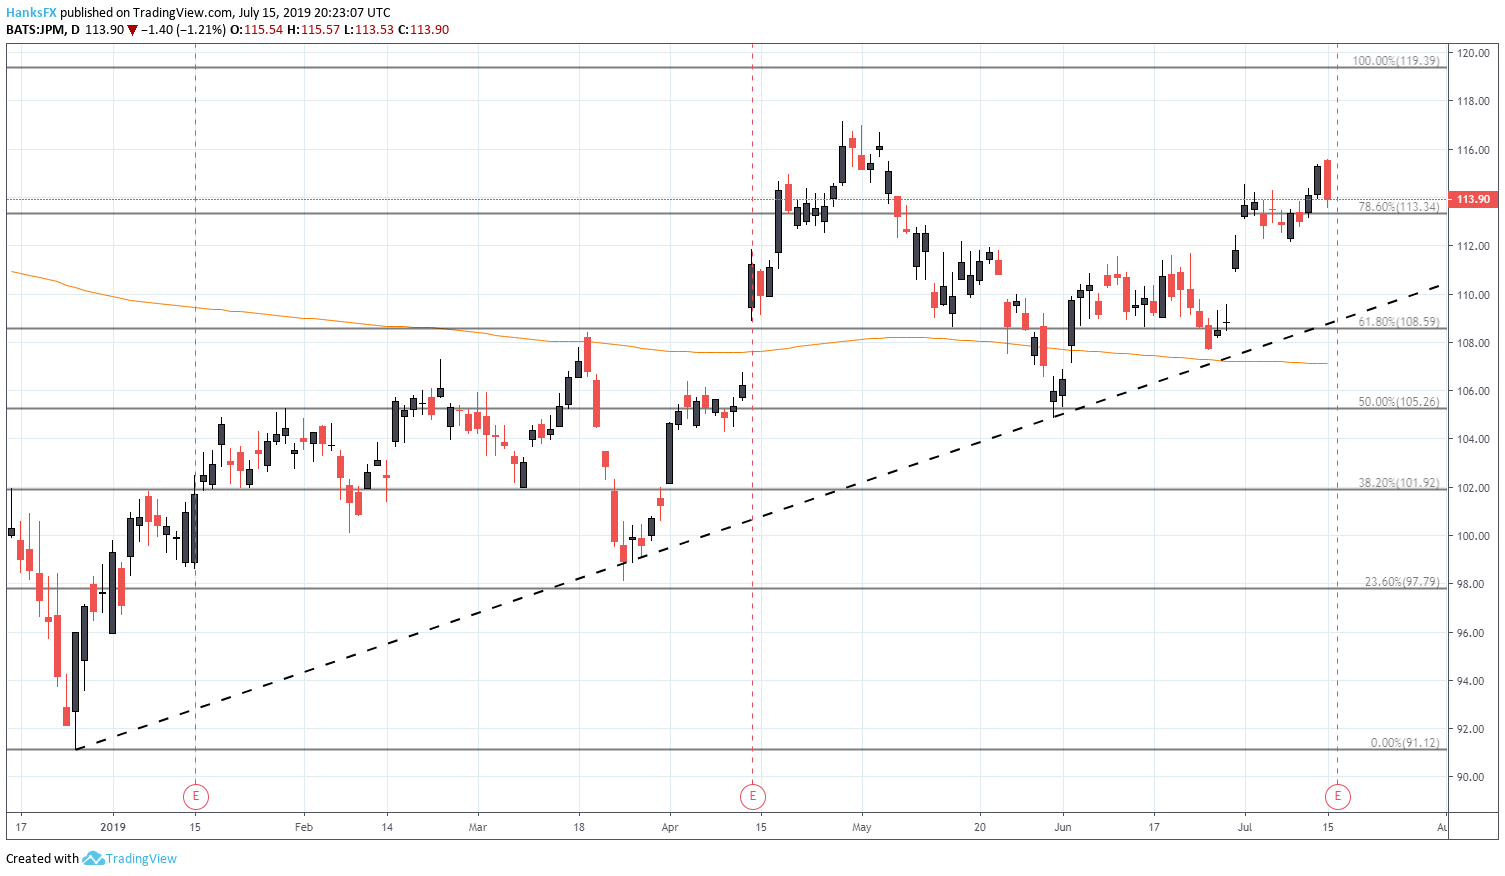
JP Morgan is next on our list and, like Goldman Sachs, has enjoyed a relatively strong 2019 thus far. JPM shares trade narrowly above a nearby Fibonacci level that may look to disrupt price action throughout Tuesday’s session. Similarly, recent highs from April and May around $117 will pose resistance to a run higher. JPM shares could enjoy a modicum of support around $111.50 before looking lower to confluent technical levels around $108.6.
JP Morgan (JPM) Price Chart: Daily Time Frame (January – July) (Chart 3)
Johnson & Johnshon (JNJ)
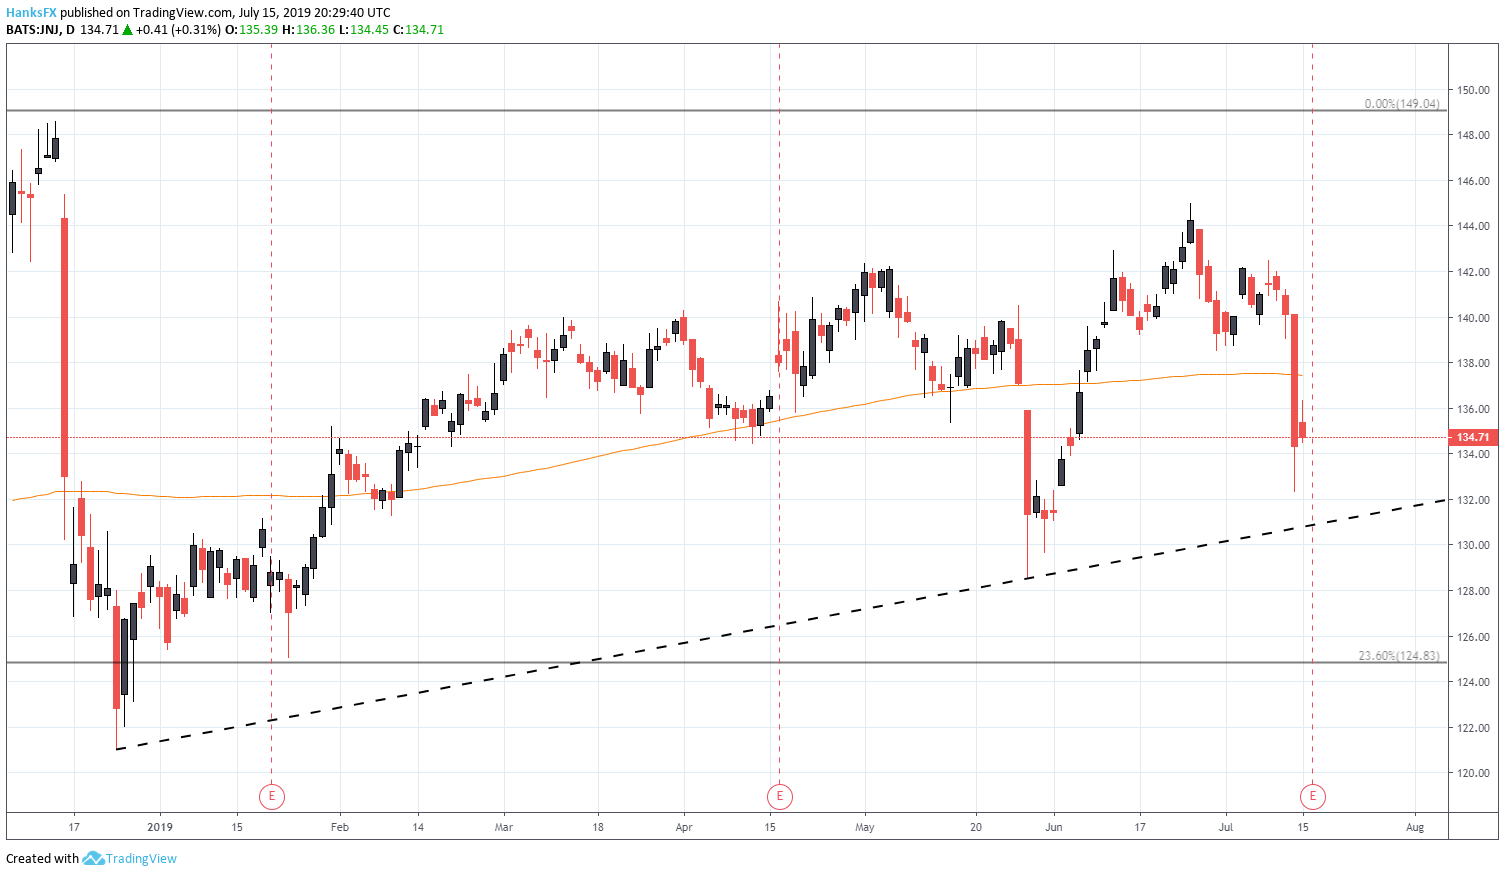
Healthcare giant JNJ is another company due to report on Tuesday but volatility surrounding the stock was already heightened before earnings arrived. The company has been accused of ties to asbestos in its baby powder formula, and a development in the case saw JNJ shares plummet $8 on Friday. The precipitous decline ripped through the 200-day moving average – which will now pose as resistance - and a disappointing report on Tuesday could pressure shares down to the ascending trendline from late December.
Johnson & Johnshon (JNJ) Price Chart: Daily Time Frame (December 2018 – July 2019) (Chart 4)
Broader Themes at Play
While each earnings report is important for the respective company’s share price, the results taken in aggregate will begin to paint a picture of corporate earnings for the quarter. Traders should look for commentary regarding monetary policy from Goldman, Wells Fargo and JP Morgan as each bank may highlight potentially lower margins as the Federal Funds rate is expected to dip. Similarly, banks are privy to information regarding capital expenditure from other firms, some of which may delay investment due to uncertainties regarding trade wars.
Earnings season has arrived! Check out our Third Quarter Equity Forecast to read about the outlook for the S&P 500 as the season unfolds.
If explicit commentary on these themes is absent, the results are still the first indicators regarding the strength of business in the United States and a string of misses would suggest the economic pulse in the country is weakening. Consequently, the S&P 500 may experience heightened volatility if a common theme emerges. In the meantime, follow @PeterHanksFX on Twitter for earnings insight.
--Written by Peter Hanks, Junior Analyst for DailyFX.com
Contact and follow Peter on Twitter @PeterHanksFX
Read more: Dow Jones, Nasdaq 100, S&P 500, DAX 30 Fundamental Forecast


