


Sterling (GBP) Price, Chart and Analysis
- GBPUSD may break back above 1.2800 in the short-term.
- The US dollar short-term price action predicated on upcoming US CPI data.
Q2 2019 GBP and USD Forecasts andTop Trading Opportunities
GBPUSD Riding US Dollar Weakness
Sterling is currently trading around 1.2730 against the US dollar and nearing highs seen around three-weeks ago. Sterling as a currency remains flat-to-weak, while the US dollar strength continues to fade as US interest rate cuts become priced into the market. Over the year, US interest rate expectations have changed course sharply from the market pricing in two/three 0.25% rate hikes to now pricing in at least two 0.25% rate cuts. The latest look at US price pressures this afternoon will dictate the next short-term move in the greenback with CPI expected to edge 0.1% lower to 1.9% in May.
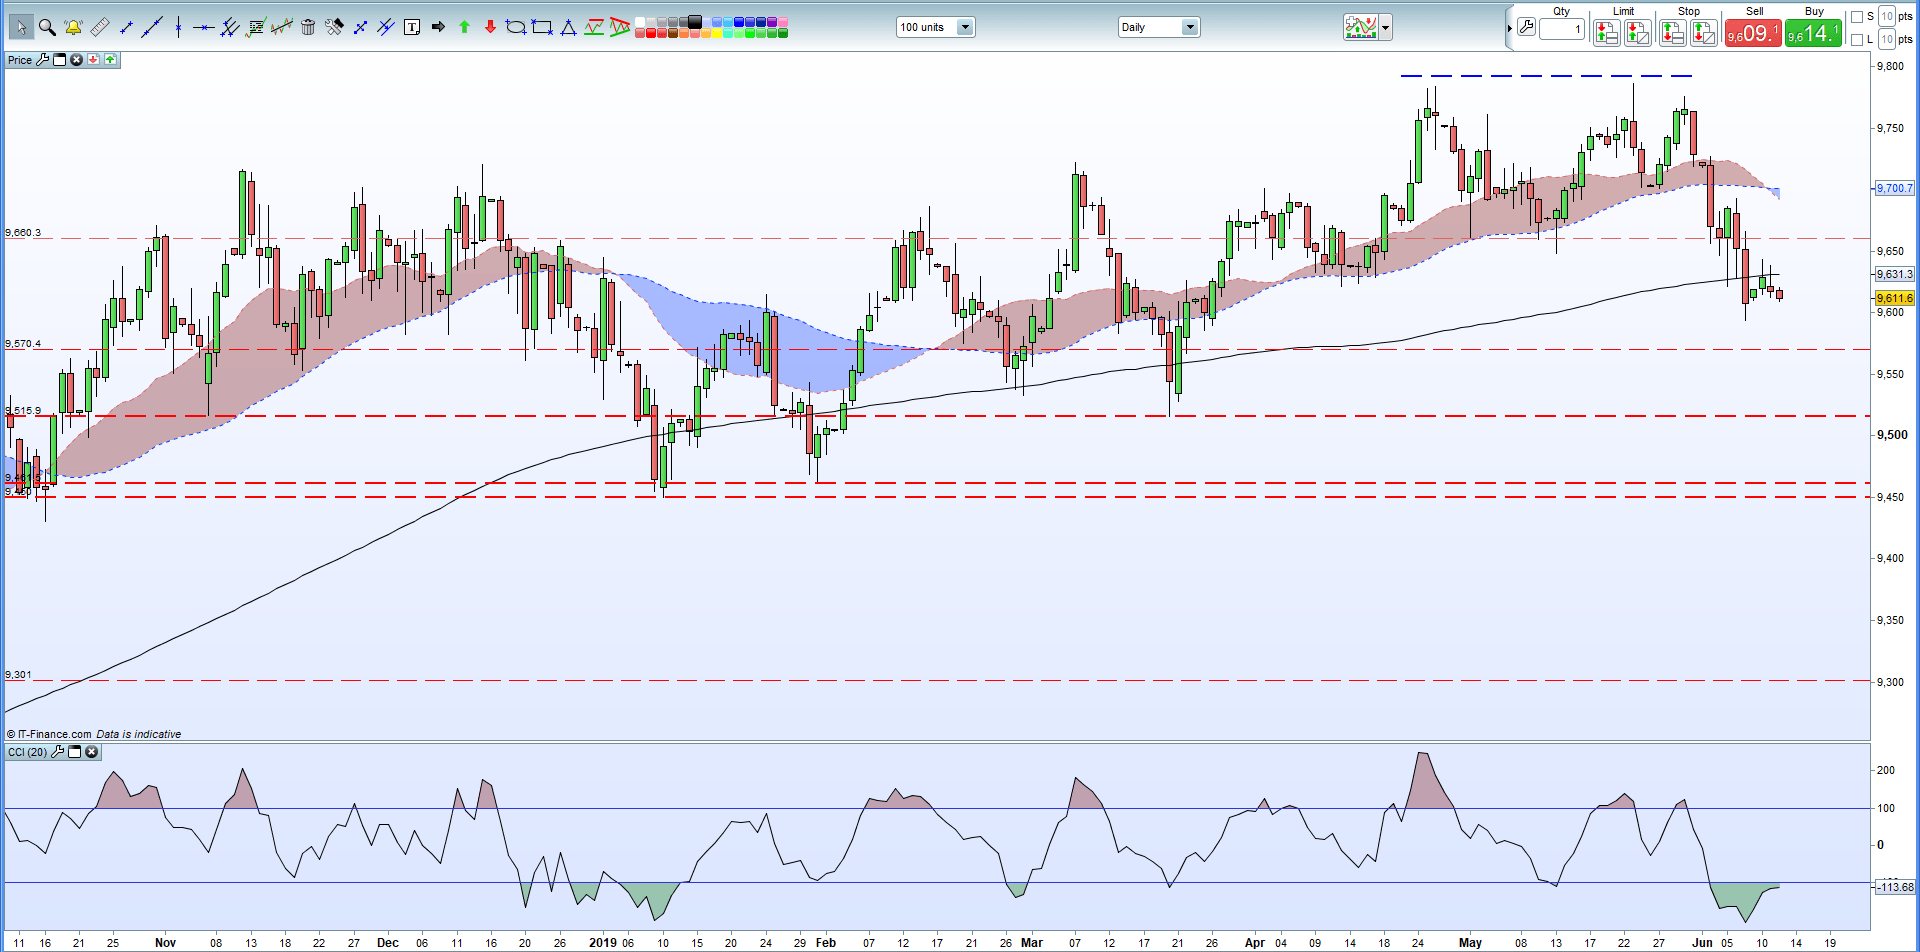
The US dollar basket (DXY) has now broken, and closed, below the 200-day moving average, a further negative sign for the greenback. Short-term bearish momentum may be contained as DXY remains in oversold territory.
US Dollar Basket (DXY) Daily Price Chart (October 2018 – June 12, 2019)
Sterling remains weak and is fully expected to remain that way as the process of choosing a new Conservative leader/Prime Minister continues. Brexit remains the candidates main battle ground with Remain candidates attacking PM favorite Boris Johnson over his plans to elave the EU on October 31, whatever the state of negotiations. The opposition Labour Party, and Conservative rebels, this afternoon are expected to launch an attempt to block a No-Deal Brexit by giving MP’s control of the process.
Sterling Weekly Forecast: GBPUSD Price Rallies to a 2-Week High.
IG Client Sentiment data paints a negative picture for the pair with 75.3% of traders long GBPUSD, a bearish contrarian bias signal. However, recent daily and weekly positional changes suggest that GBPUSD may soon reverse higher.
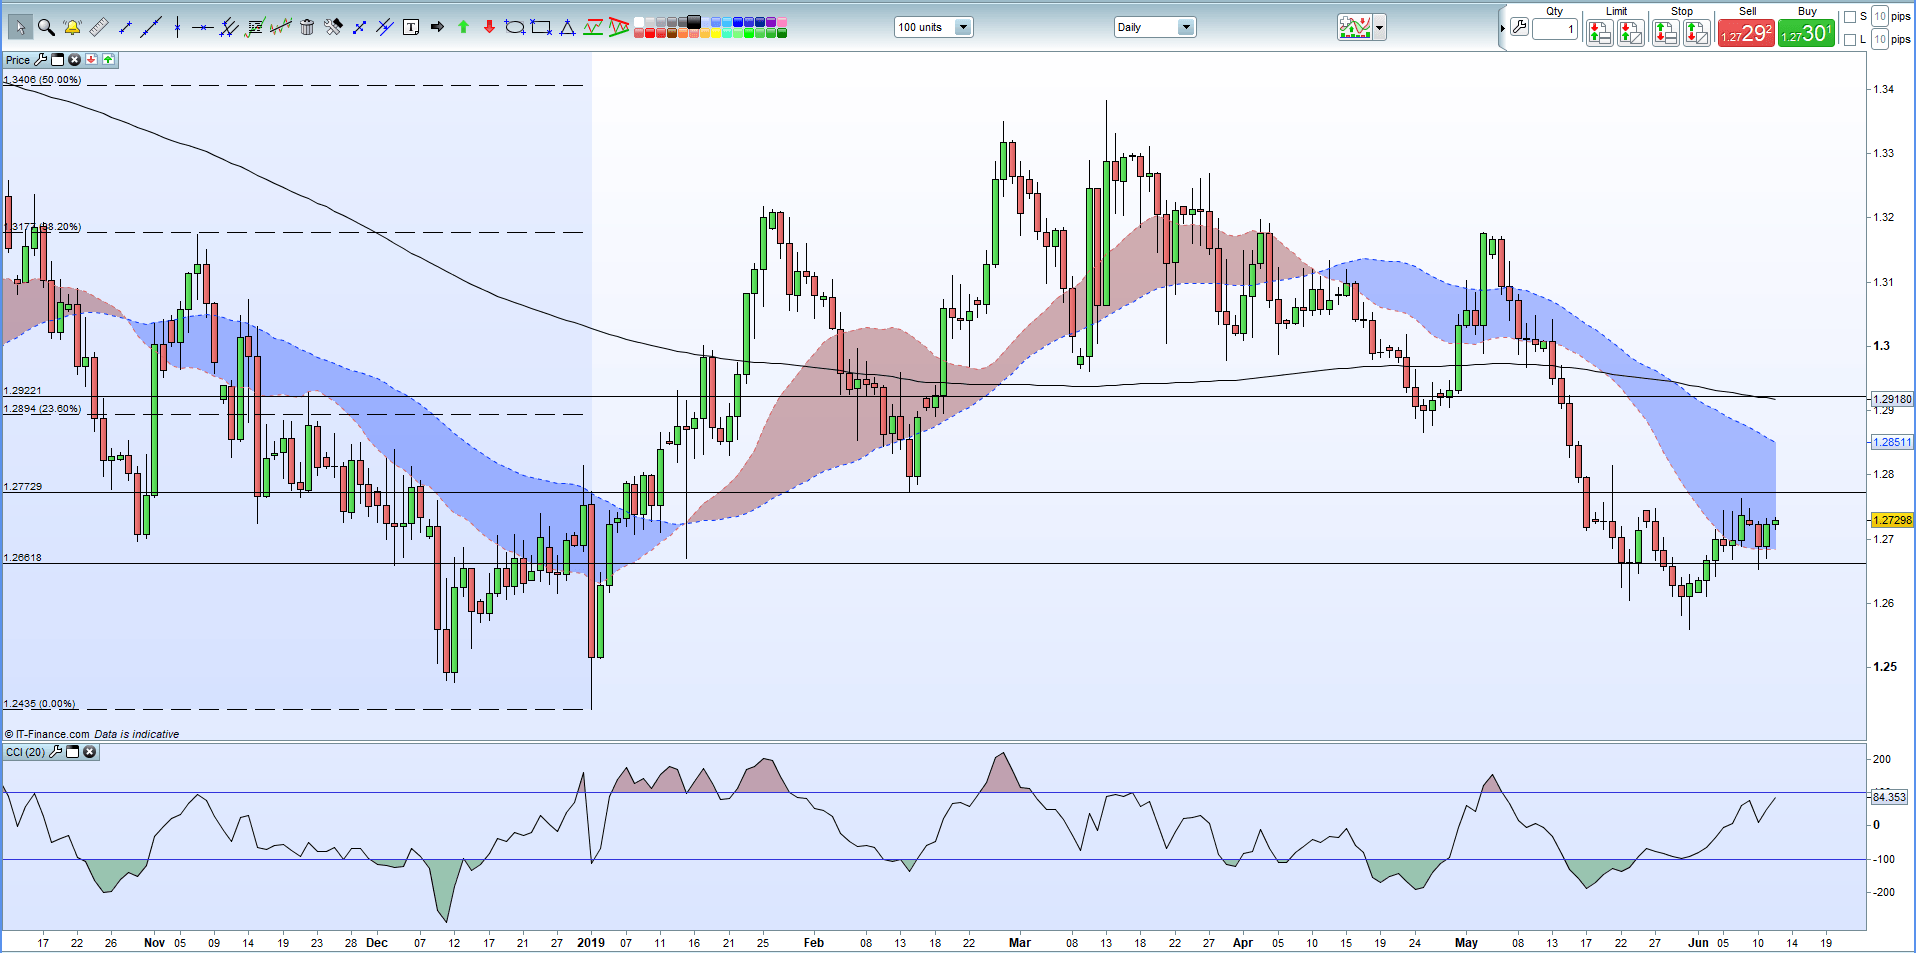
GBPUSD is eyeing 1.2765, a near one-month high, with little resistance in the way of the move. After here, the May 21 spike high at 1.2815 comes into play, ahead of the 23.6% Fibonacci retracement level at 1.2894 and the 200-day moving average at 1.2920. The CCI indicator is suggesting that the recent short-term move higher may be getting overstretched.
GBPUSD Daily Price Chart (October 2018 – June 12, 2019)
Traders may be interested in two of our trading guides – Traits of Successful Traders and Top Trading Lessons – while technical analysts are likely to be interested in our latest Elliott Wave Guide.
What is your view on GBPUSD – bullish or bearish?? You can let us know via the form at the end of this piece or you can contact the author at nicholas.cawley@ig.com or via Twitter @nickcawley1.


