


USDMXN – TALKING POINTS
- Spot USDMXN continues to wedge between bullish and bearish trend lines
- Mexican Peso gains against the greenback despite Banxico lowering 2019 GDP estimates
- Forex traders shift focus to US economic data due Thursday
- Find out How to Trade Emerging Market Currencies or download this free educational guide on Using News and Events to Trade Forex
USDMXN dipped during Wednesday’s trading session despite Banxico – Mexico’s central bank – slicing the country’s 2019 GDP growth forecast range by 0.3 percent. Banxico now expects economic activity to expand between 0.8 percent and 1.8 percent this year while maintaining its 2020 GDP growth estimates of 1.7 to 2.7 percent. Banxico’s head central banker Alejandro Diaz de Leon stated that the downward revision for 2019 was “due to temporary elements,” but added that the country’s economy is “trending toward a slowdown.”
The peso has faced economic growth headwinds since Mexico’s GDP report released late April which showed a 0.2 percent contraction during 1Q 2019. Although, positive developments made on the pending USMCA deal bolstered the Mexican Peso earlier this month, but gains have since been offset by widespread USD strength as currency traders seek safety in the greenback amid rising global risks. Looking forward, spot USDMXN traders turn their attention to a host of high-impact US economic indicators due for release during Thursday’s session.
FOREX ECONOMIC CALENDAR – USD
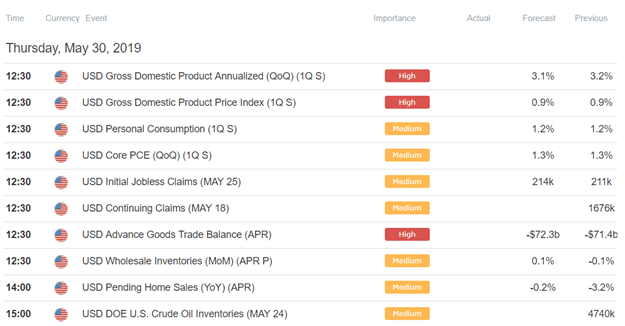
Along with a true-up of the 1Q 2019 US GDP report and personal consumption numbers, April’s advance goods trade balance data looks to provide additional clarity on the economic partnership between the US and Mexico. US imports from Mexico will likely be scrutinized for signs of better-than-expected numbers which has potential to inspire USDMXN bears considering Mexico GDP is heavily tied to trade with the US. Also worth mentioning is the fact that Mexico has been a large beneficiary of the ongoing US China Trade War seeing that the Latin American country now tops China as the largest exporter to the US.
USDMXN PRICE CHART: DAILY TIME FRAME (JANUARY 28, 2019 TO MAY 29, 2019)
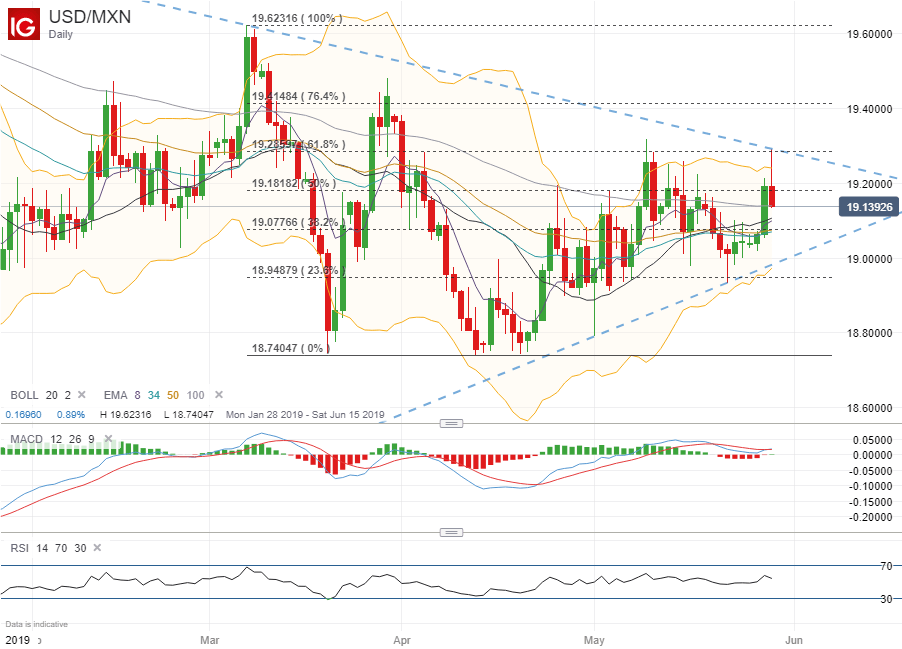
Spot USDMXN has coiled into a tight wedge formed by a series of lower highs and higher lows since mid-March. The currency pair recently ran into resistance at the 61.8 percent Fibonacci retracement level drawn from the respective monthly high and low recorded in March and April. A breach above this price level and bearish downtrend resistance could open to door to a bullish bias, but resistance posed by the 50.0 percent retracement level needs to be overcome first. Conversely, USDMXN downside could target support near the 38.2 percent Fib and short-term EMAs. If spot prices break below this level and the bullish uptrend line, USDMXN bears could quickly target the 23.6 percent Fibonacci line which has recently served as an area of confluence.
- Written by Rich Dvorak, Junior Analyst for DailyFX
- Follow @RichDvorakFX on Twitter


