


Crude Oil Price Chart and Analysis:
- Crude oil dips below $70.00/bbl. as trade tensions rattle risk markets.
- Short-term chart breakdown, six-week low in sight.
The Brand New DailyFX Q2 2019 Trading Forecast and Guides are Available to Download Now!!
How to Trade Oil: Crude Oil Trading Strategies & Tips.
Crude oil continues to drift lower, dragging equity markets down in its wake, on a combination of rising US oil output and heightened US-China trade war concerns. The latest move lower has broken the recent uptrend and further losses cannot be discounted.
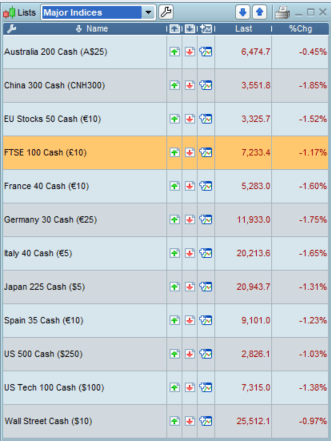
Global equity markets are a sea of red Thursday as investors continue to shed riskier assets. A backdrop of growing fears that US-China trade negotiations are going nowhere continue to weigh on global growth expectations, with some equity markets nearing multi-week lows.
DAX 30 and CAC 40 Technical Update: Support Patterns to Watch
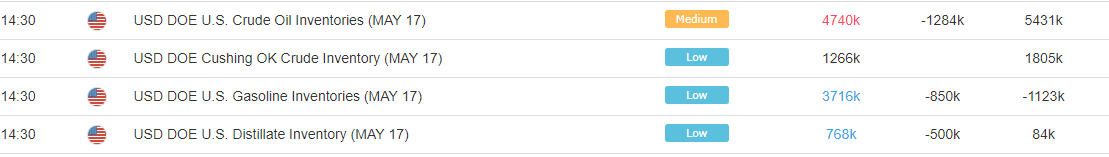
The latest US crude oil inventory data showed increased output and weaker demand, weighing on oil, with the US crude inventories rising to their highest levels in just under two years. The ongoing glut in US oil is being partially offset by ongoing OPEC production cuts which are likely to be extended into H2.
WTI vs Brent: Top 5 Differences Between WTI and Brent Crude Oil
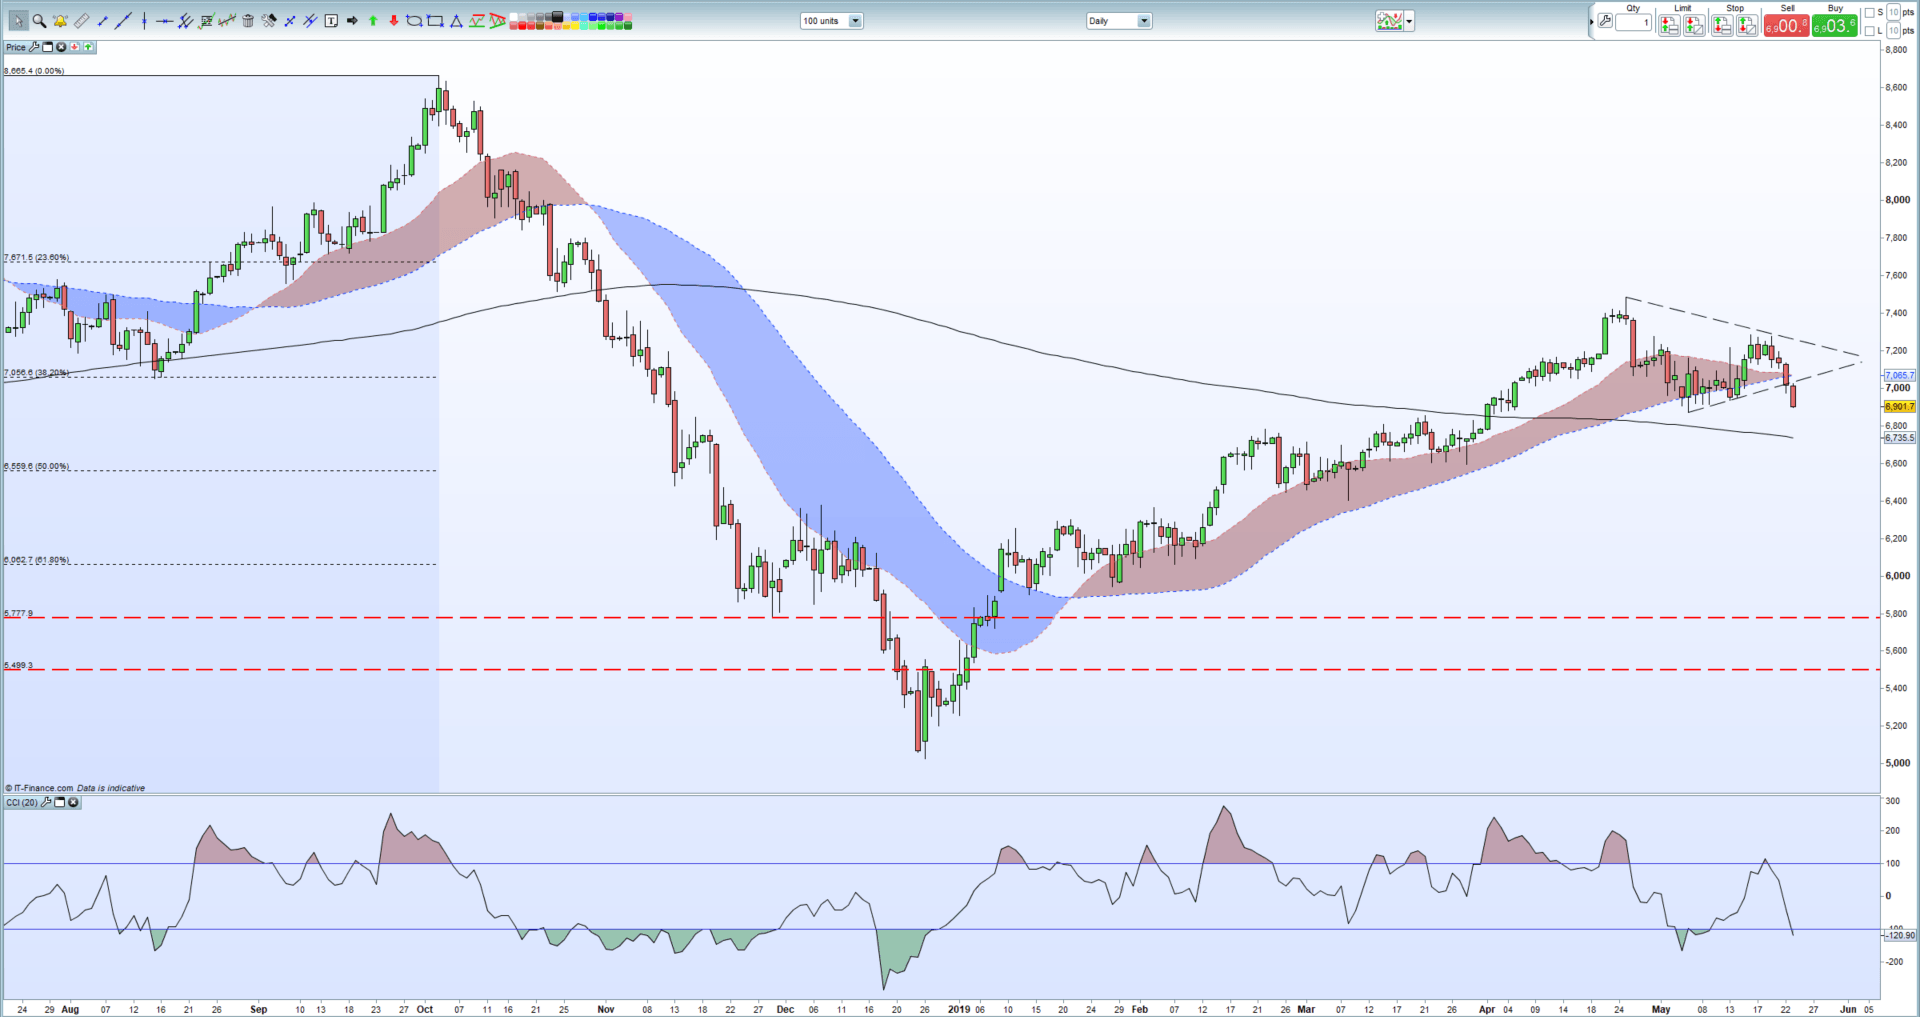
The technical picture for oil is suggesting marginally lower prices with support from the 38.2% Fibonacci retracement level at $70.56/bbl. broken on Wednesday. Oil has also fallen through the recent uptrend off the May 6 low around $68.76/bbl. and this low now becomes the next downside target. Below here the 200-day moving average at $67.30/bbl. comes into play. The CCI indicator has moved into oversold territory and this may stem, or slow down, current negative price sentiment.
Crude Oil Daily Price Chart (July 2018 – May 23, 2019)
Traders may be interested in two of our trading guides – Traits of Successful Traders and Top Trading Lessons – while technical analysts are likely to be interested in our latest Elliott Wave Guide.
What is your view on crude oil – bullish or bearish?? You can let us know via the form at the end of this piece or you can contact the author at nicholas.cawley@ig.com or via Twitter @nickcawley1.


