


Dow Jones Price Outlook:
- Wednesday’s recovery rally did little to convince retail clients of a sustained follow-through as they looked to short the Dow Jones
- Despite bullish price action, the Industrial Average remains off -1.15% for the week
- Find out how to use IG Client Sentiment Data with one of our Live Sentiment Data Walkthroughs
Dow Jones Price Outlook: Retail Traders Conflicted as Index Rebounds
After a rocky start to the week, US equities have mounted a recovery effort. As of Wednesday’s close, the Dow Jones trades -1.15% lower than it opened, compared to the S&P 500 and Nasdaq 100 which trade -1.05% and -1.10% beneath their close last Friday. That said, retail traders have wavered in their positioning on the Dow Jones, whereas sentiment for the S&P 500 has decidedly pessimistic.
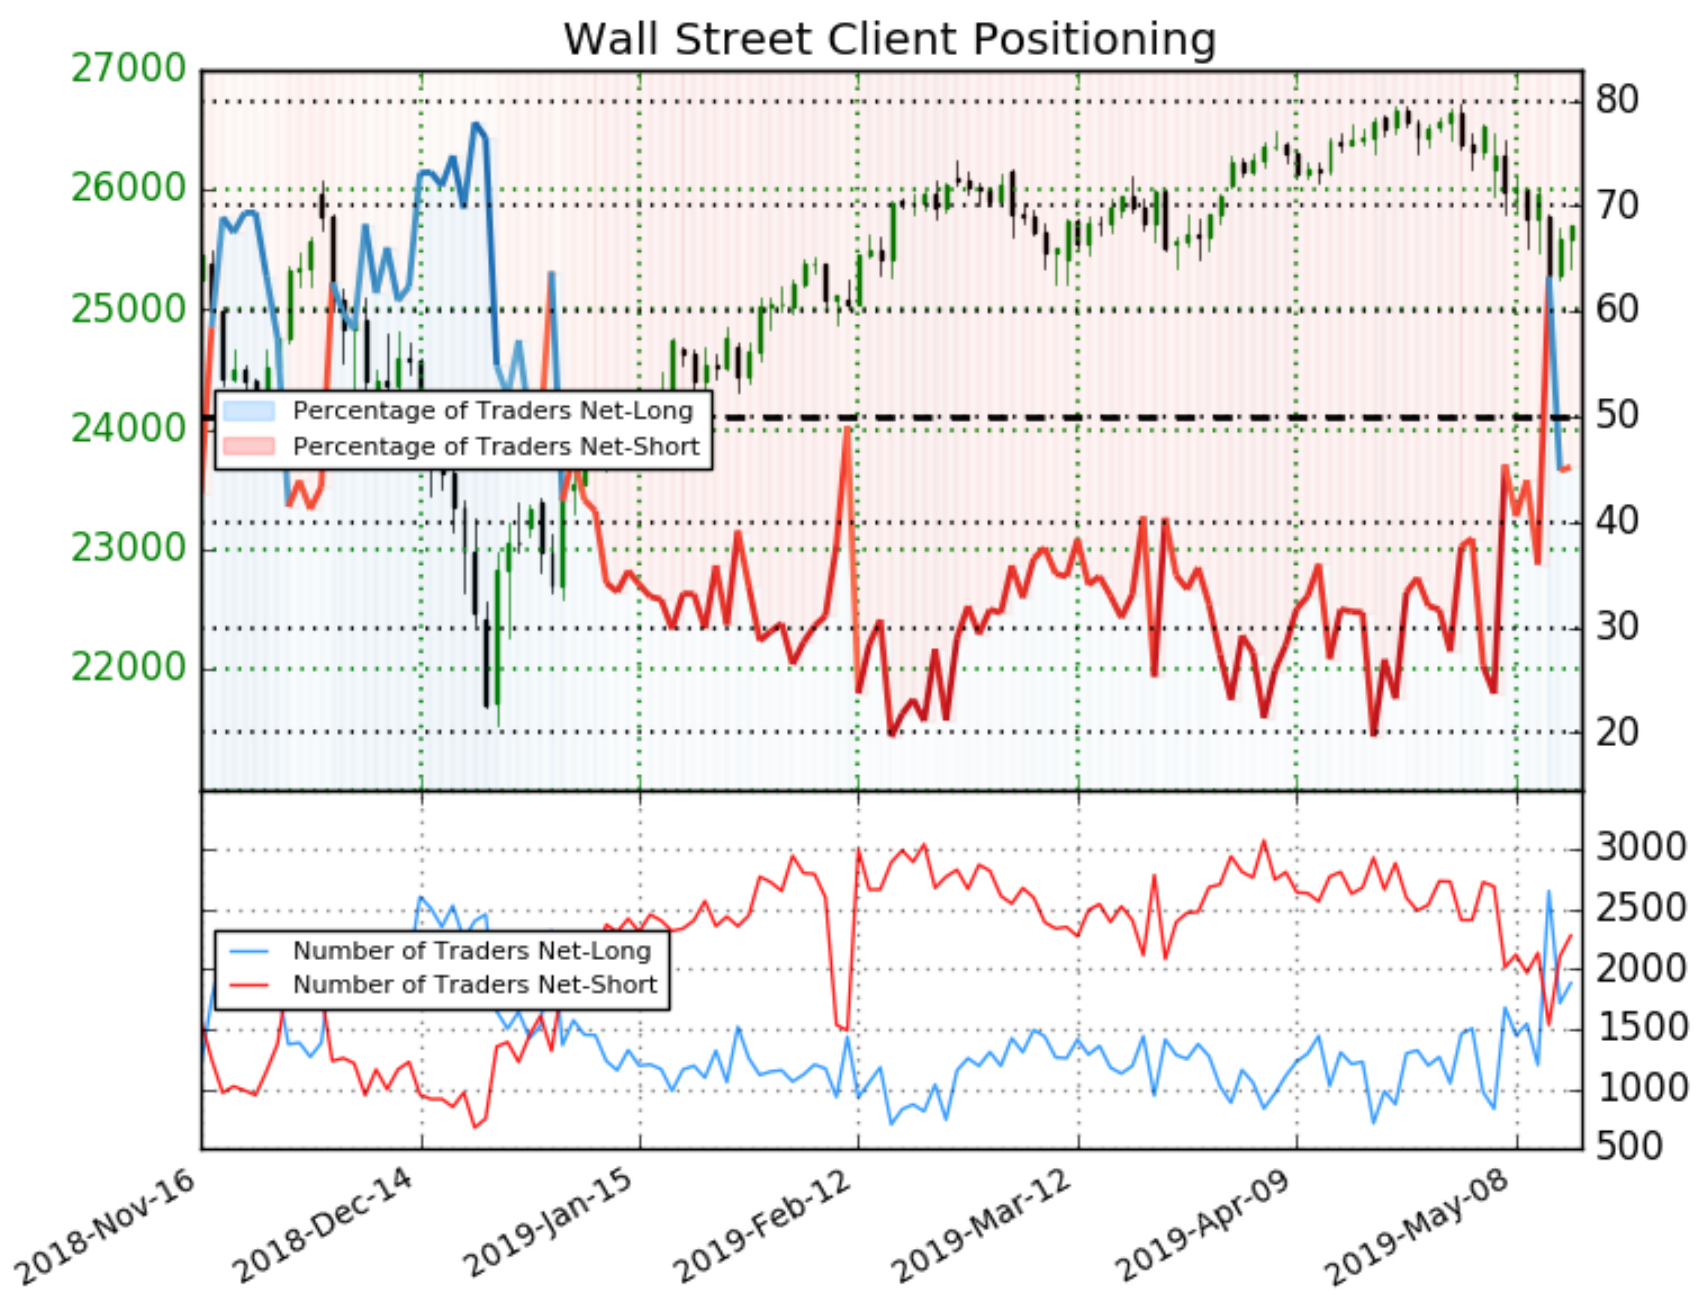
For the first time since early January, IG clients were net-long the Dow Jones on Monday – suggesting some traders were optimistic the index’s descent was over or that trader’s targets were hit. Either way, the optimism didn’t last long as shorts came raging back. While we at DailyFX typically view client positioning as a contrarian indicator, the current signal is relatively unclear. That said, traders are much more certain the S&P 500 will continue to lose ground.
View A Brief History of Trade Wars to read about the precedents set in prior economic conflicts.
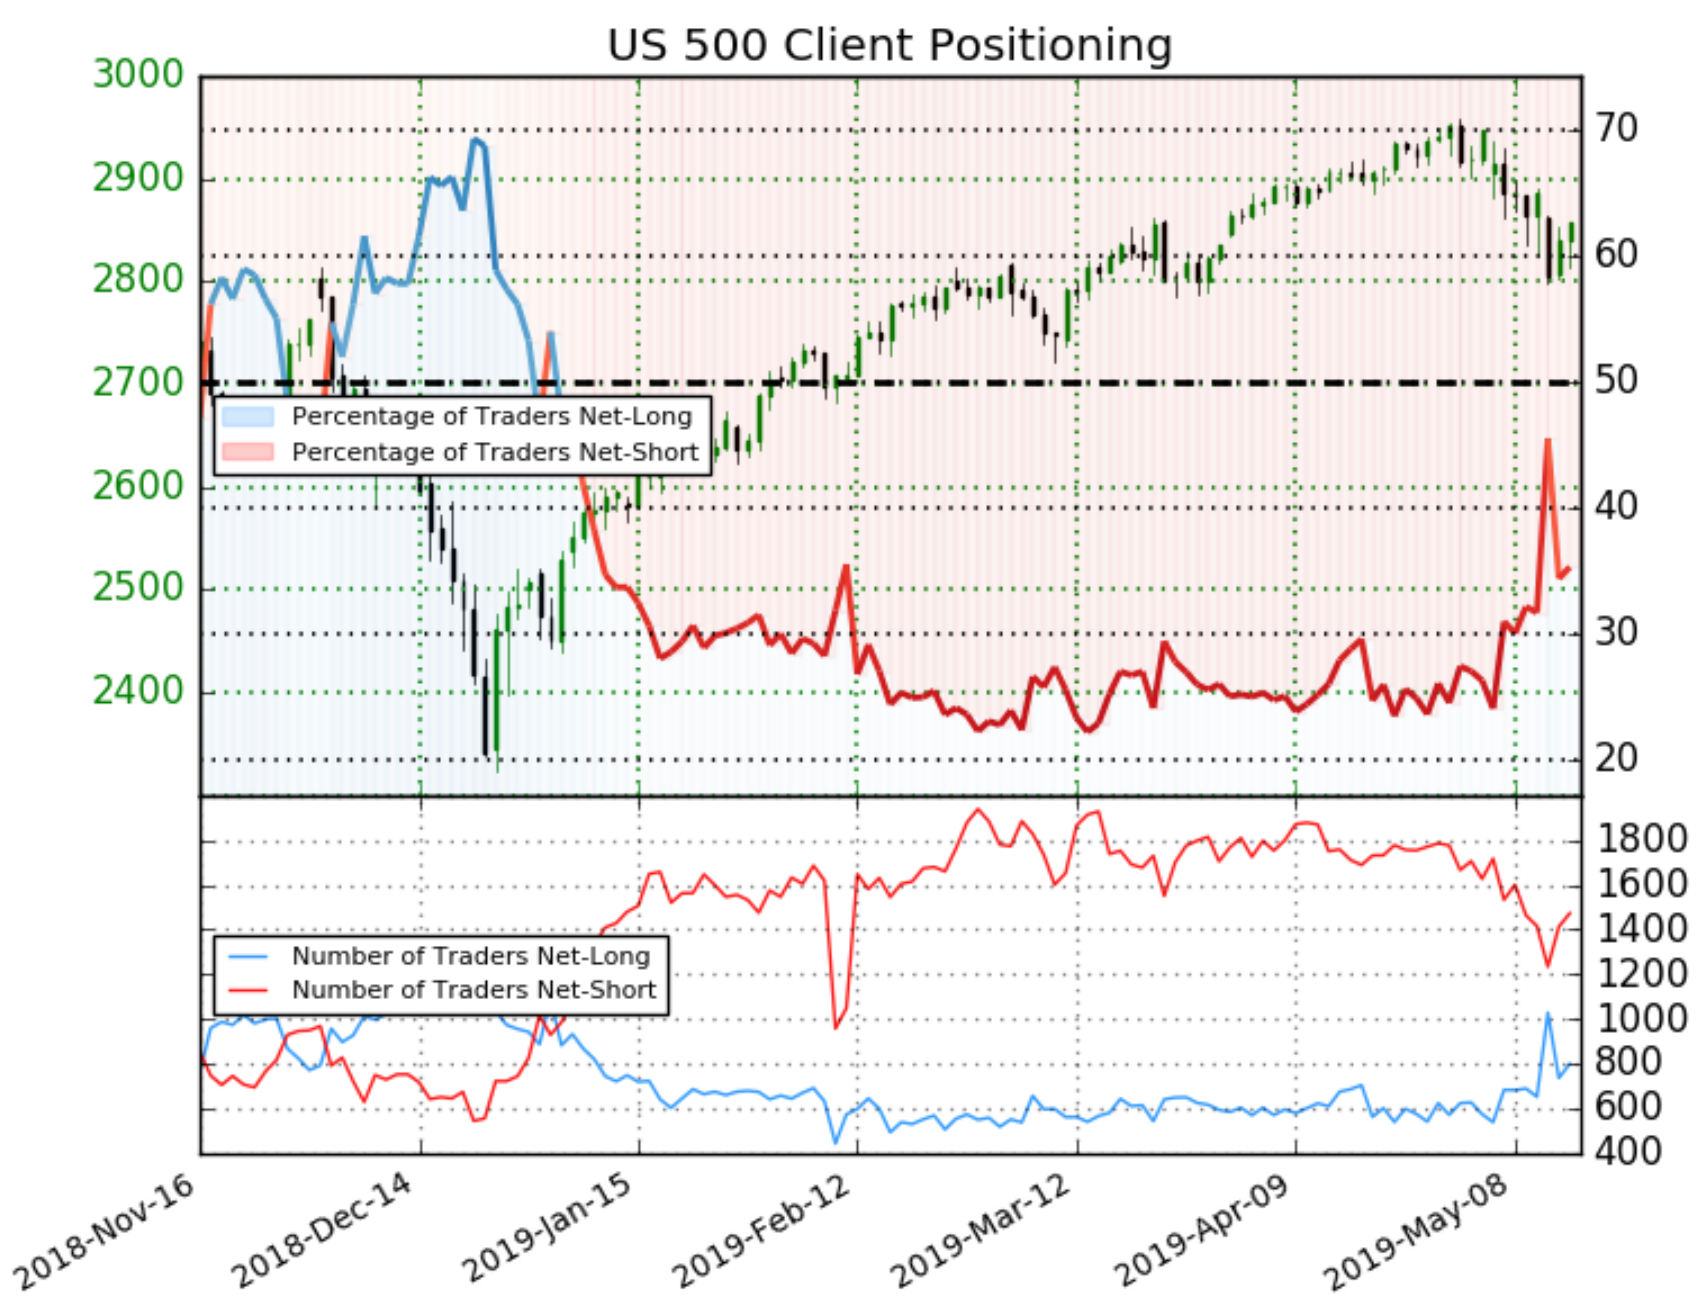
Despite facing many of the same themes, client positioning on the S&P 500 reveals that traders are overwhelmingly short the index - even amid its 13.5% gain in the year-to-date. Given the conflicting signals from IGCS, traders must look to other tools like technical and fundamental analysis to assist in their decision making.
Dow Jones Price Chart: 1 - Hour Time Frame (May 6 - May 15) (Chart 1)
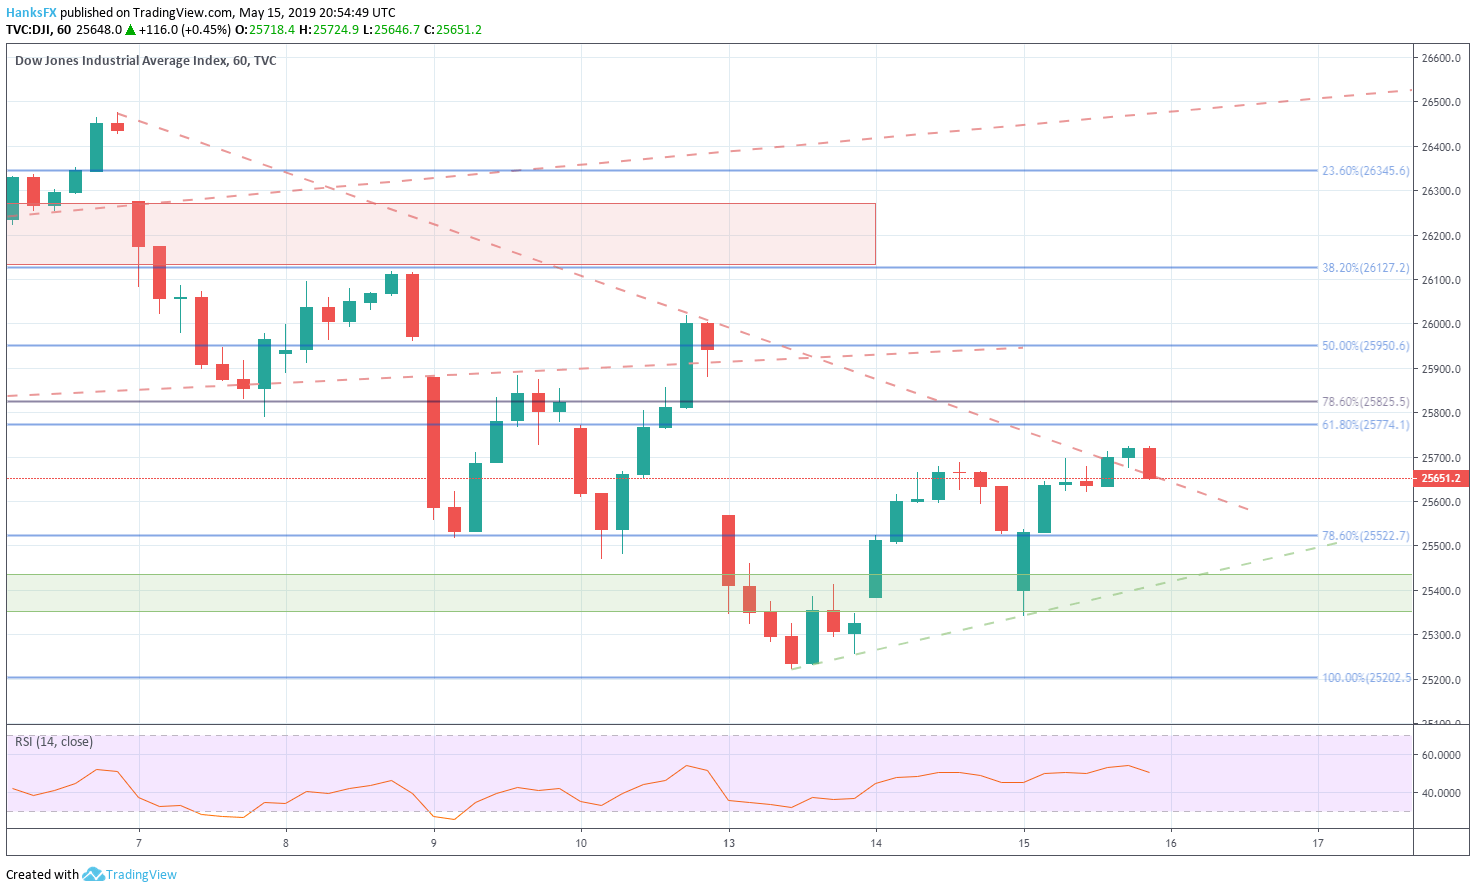
After two weeks of tumultuous volatility, the Average was able to drive outside a descending trendline from May 6 only to close marginally beneath, suggesting the level will pose resistance in Thursday trading. Beyond that, bulls will have to negotiate a litany of Fibonacci levels. First the 61.8% at 25,774, followed by the 78.6% at 25,825. Both have stalled price action in the past.
On the other hand, bears will hope to open beneath the trendline from May 6 before testing the 78.6% retracement from March’s lows to April’s highs. Subsequent support will be offered by a short-term ascending trendline from the swing low on May 13, followed by a band of support derived from the lows on March 25 and 27.
Given the severity of declines during the last two weeks, it is my opinion that the index may be due for consolidation before a more-earnest rebound can be mounted – assuming a relatively stable fundamental landscape. For a deeper look at IG Client Sentiment data and the Dow Jones, sign up for my Sentiment Data Walkthrough Webinar tomorrow. In the meantime, follow @PeterHanksFX on Twitter for other equity insight.
--Written by Peter Hanks, Junior Analyst for DailyFX.com
Contact and follow Peter on Twitter @PeterHanksFX
Read more: S&P 500 Outlook: ETF Flows Suggest Flight to Currency Market
DailyFX forecasts on a variety of currencies such as the US Dollar or the Euro are available from the DailyFX Trading Guides page. If you’re looking to improve your trading approach, check out Traits of Successful Traders. And if you’re looking for an introductory primer to the Forex market, check out our New to FX Guide.


