


Bitcoin (BTC), Ripple (XRP) and Litecoin (LTC) Price Outlook, Chart and Analysis:
- Crypto-rally backed up by huge increase in volume.
- Any sell-offs may suggest a new entry point.
IG Client Sentiment Data show how retail are positioned in a variety of cryptocurrencies. See how daily and weekly positioning can affect our trading bias. Bitcoin (BTC) trade data show 76.6% of traders are net-long, a strong contrarian bearish signal. However, recent daily and weekly changes in sentiment suggest that Bitcoin may soon move higher.
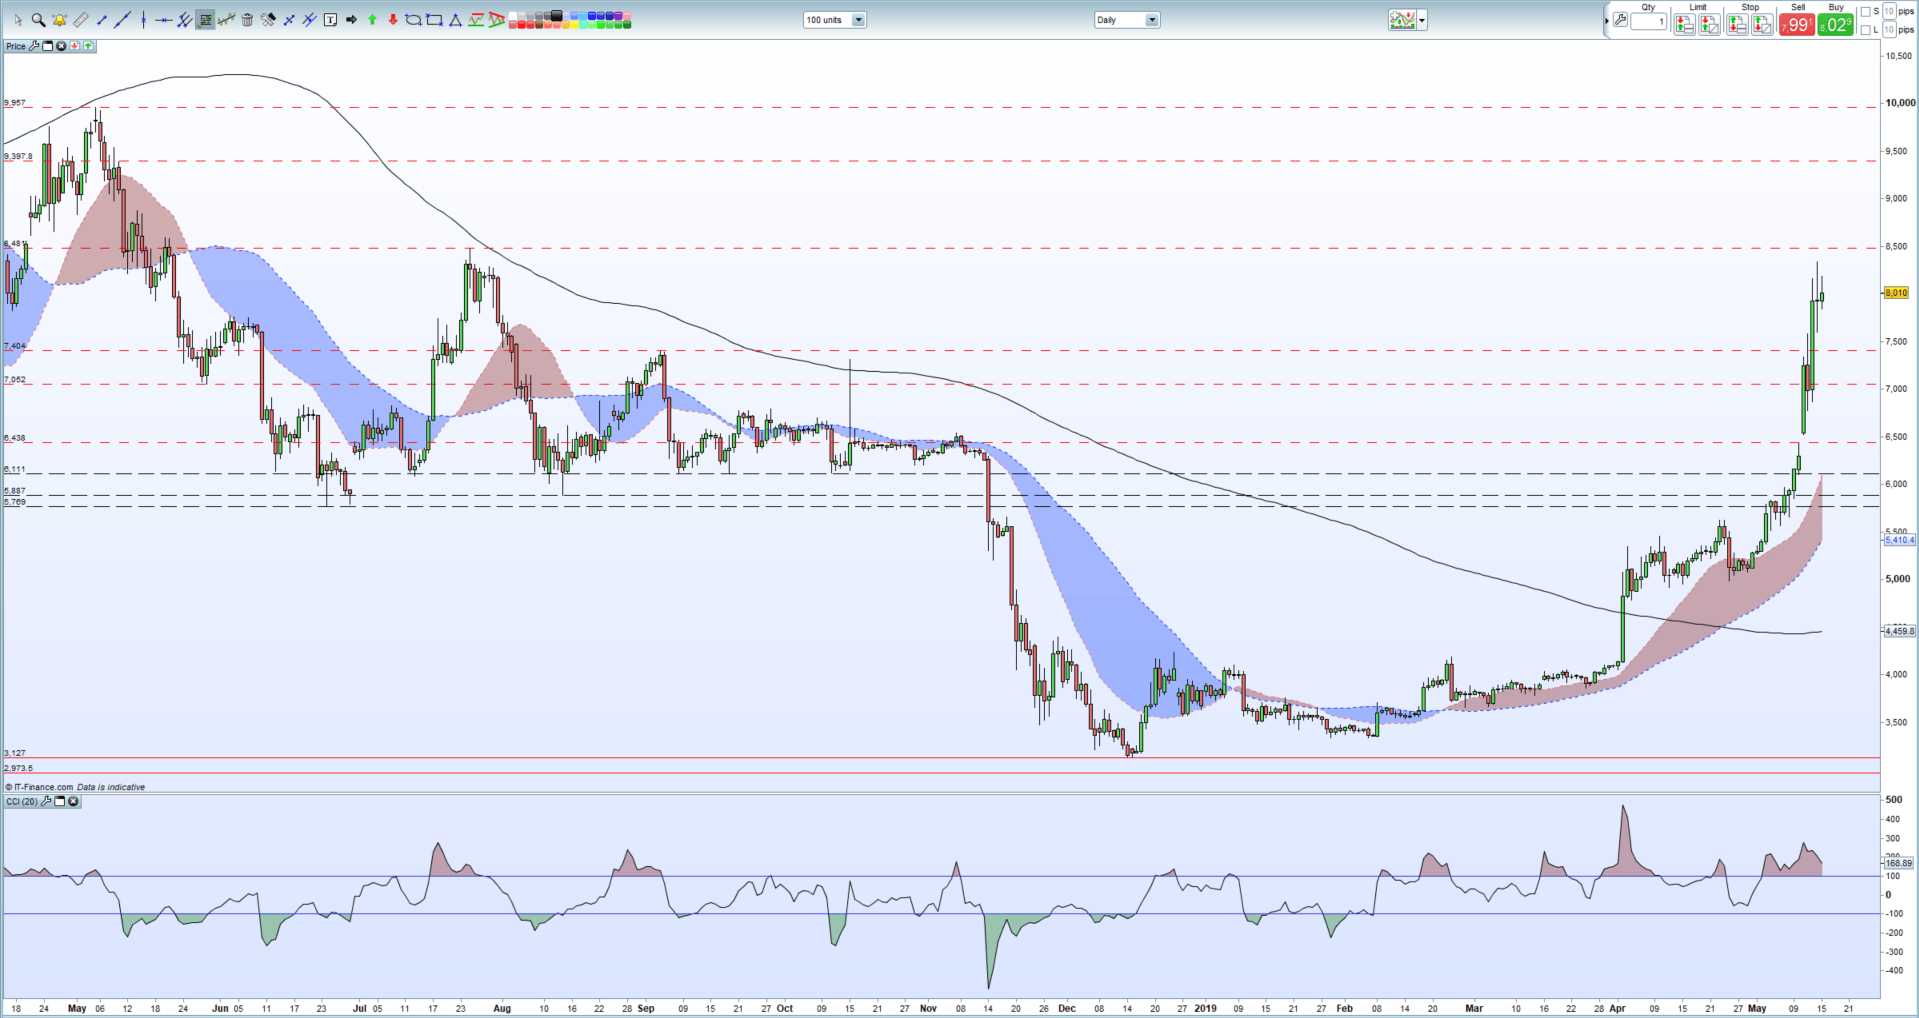
Bitcoin (BTC) Rally May Target $10,000
The recent jump in Bitcoin may not be its last if any sell-off consolidates around the $7,400 level, and if the latest pick-up in volume continues. Bitcoin daily turnover hit just USD 32 billion on Tuesday, nearly six times the volume seen in mid-February when prices were stagnant around $3,650.The 40%+ rally in May has had no fundamental drivers but the charts have pointed to various attainable resistance levels that, if broken, would lead to further moves higher. A period of consolidation may be needed before the next move higher – preferably above $7,400 – and if this is the case, an old swing-high at $8,481, the 61.8% Fibonacci retracement around $9,400 and the May 4, 2018 high at $9,957 all need to be considered.
A Guide to Day Trading Bitcoin and Other Cryptocurrencies.
Bitcoin (BTC) Daily Price Chart (April 2018 – May 15, 2019)
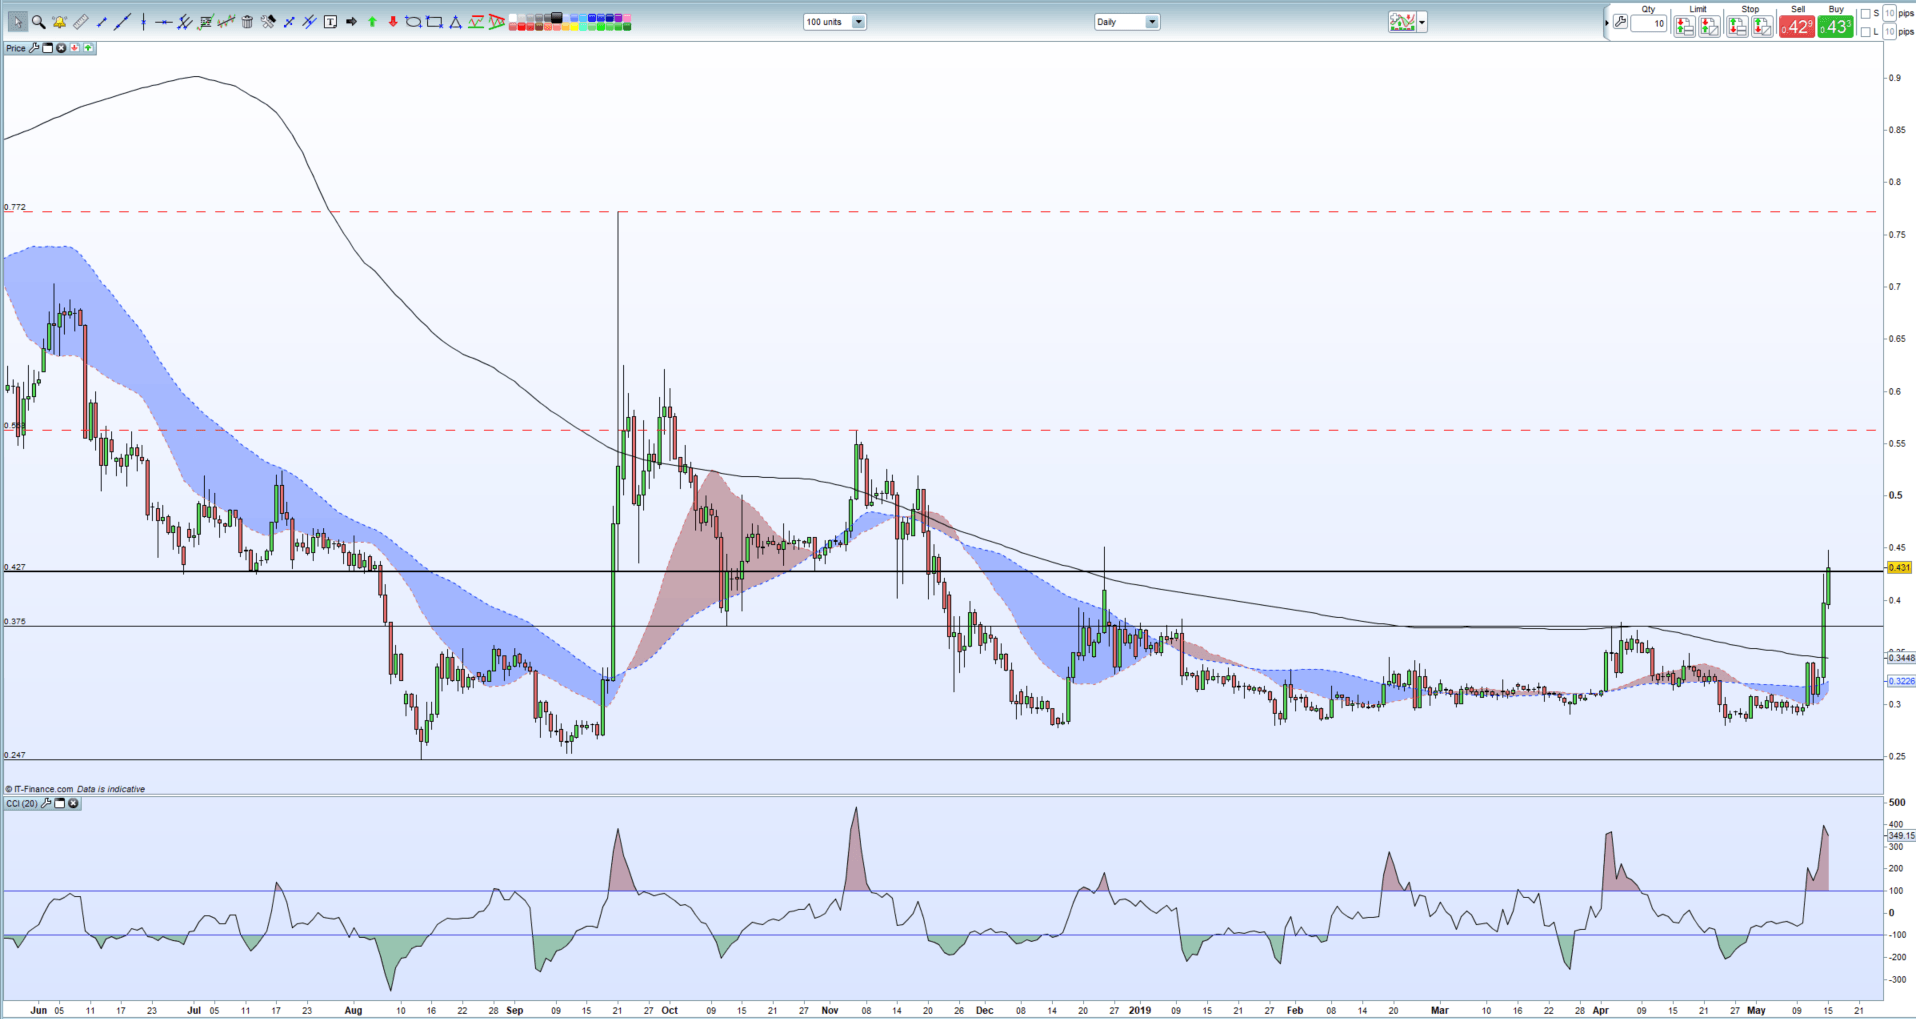
Ripple (XRP) Looking Overbought in the Short-Term
Another cryptocurrency that exploded higher in the last week and back to highs last seen in mid-December last year. While the Bitcoin chart looks overbought, Ripple looks extremely overbought using the CCI indictor and if the past is anything to go by, a sell-off may be on the cards. Initial support kicks-in around $0.37 - $0.38 ahead of a recent double-top and the 200-day moving average around $0.34. To the upside $0.57 followed by $0.77, the September 2018 ‘spike-high’.
Ripple (XRP) Daily Price Chart (June 2018 – May 15, 2019)
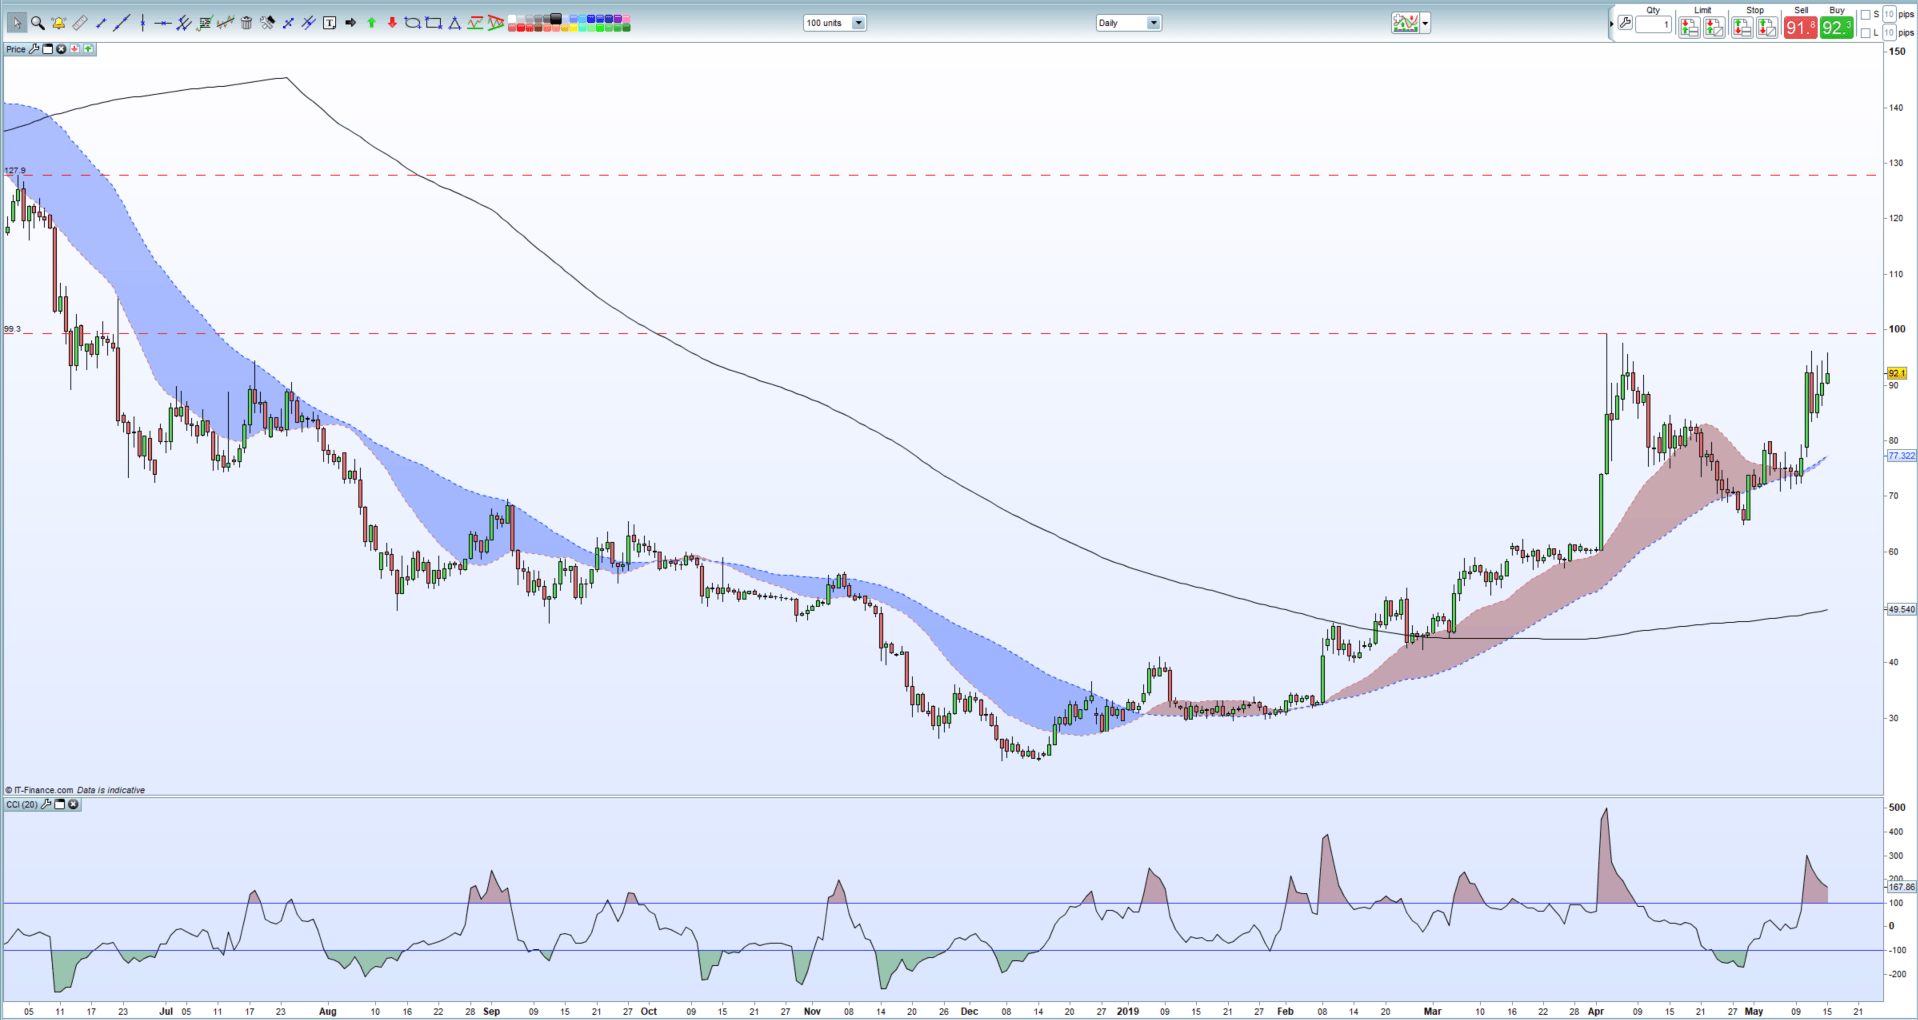
Litecoin (LTC) Eyes $100 as Next Bull Target
Litecoin has moved higher, but in not such as explosive fashion as other cryptos and remains below the two-day spike at $100 seen in late April. This is the first target for a move higher, followed by an old swing-high at $128 and the May 2018 high at $183. The five recent higher lows in a row should provide support against any sell-off. Again, the chart looks overbought but has come off its recent peak.
Litecoin (LTC) Daily Price Chart (June 2018 – May 15, 2019)
Traders may be interested in two of our trading guides – Traits of Successful Traders and Top Trading Lessons – while technical analysts are likely to be interested in our latest Elliott Wave Guide.
What is your view on Bitcoin, Riple and Litecoin – bullish or bearish?? You can let us know via the form at the end of this piece or you can contact the author at nicholas.cawley@ig.com or via Twitter @nickcawley1.


