


Dow Jones, S&P 500, Nasdaq 100 Price Outlook:
- The Dow Jones was able to close Thursday’s session slightly above key support, but now faces trendline resistance to the topside
- The S&P 500 trades narrowly above a key Fib level at 2,865
- Conversely, the Nasdaq finds itself distant from the nearest Fib level after a strong Thursday recovery
Dow Jones, S&P 500, Nasdaq 100 Price Outlook
After a painful week for US equities, Thursday trading offered a bright spot. After a series of comments from President Trump injected optimism into markets, a recovery effort was mounted in afternoon trading. The three major indices were able to climb considerably off their lows, but only the S&P 500 closed higher than it opened. US equities will now await trade war developments to influence price action in Friday’s session. Here are the technical levels to watch.
View our Economic Calendar for upcoming data releases.
Dow Jones Price Outlook
The Dow Jones has been the worst performing major index in the year-to-date, despite its climb of more than 10.5%. Headed into Friday trading, the Average will have two nearby Fib levels to buoy price. First is the 78.6% Fibonacci retracement from the highs in October to the lows in December around 25,823. Second is the 61.8% from March’s lows to April’s highs at 25,774. Should those levels be breached, 25,522 - which marked the low of Thursday trading – can be looked to for subsequent support and the 78.6% retracement level.
Dow Jones Price Chart: 4 – Hour Time Frame (February 2019 – May 2019) (Chart 1)

To the topside, a trendline at 25,880 will also look to influence price followed by the 50% retracement at 25,950. The altitude at which the Dow trades offers an interesting setup. A trade war breakthrough would likely equate to a seriously bullish development that would see nearby resistance rendered obsolete. On the other hand, a breakdown would look to test the lows around 25,522 – a line in the sand before deeper selling.
S&P 500 Price Outlook
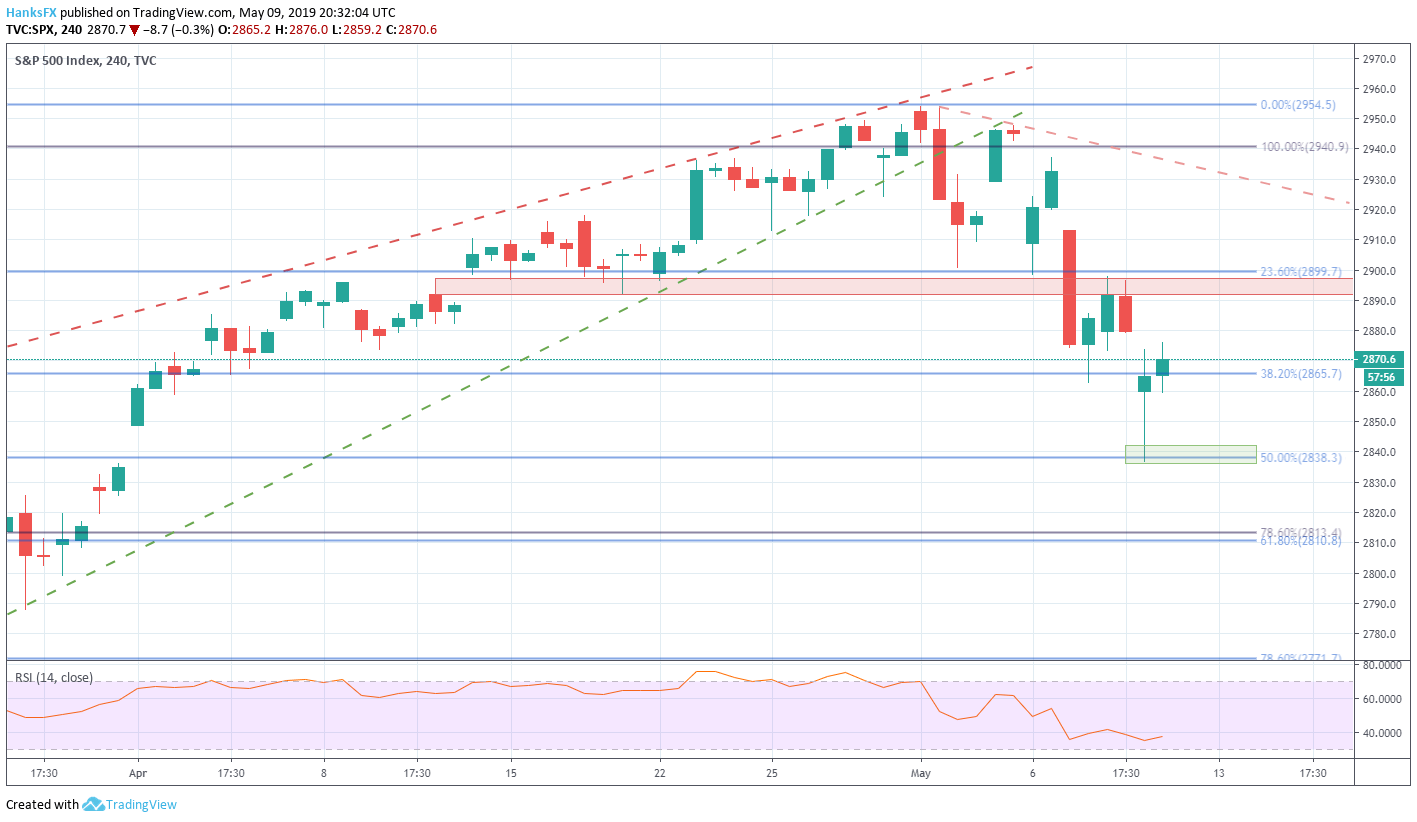
Similarly, the S&P 500 was able to surmount a Fibonacci level in Thursday trading and will look to it for support in Friday’s session. Both the 38.2% and the 50% at 2,865 and 2,838 respectively should give pause to an attempted move lower. By comparison, the top side is relatively open. Resistance around 2,900 from the 23.6% Fib and psychological level will be a difficult barrier to break. That said, the path higher is relatively clear after that.
S&P 500 Price Chart: 4 – Hour Time Frame (February 2019 – May 2019) (Chart 2)
Nasdaq 100 Price Outlook
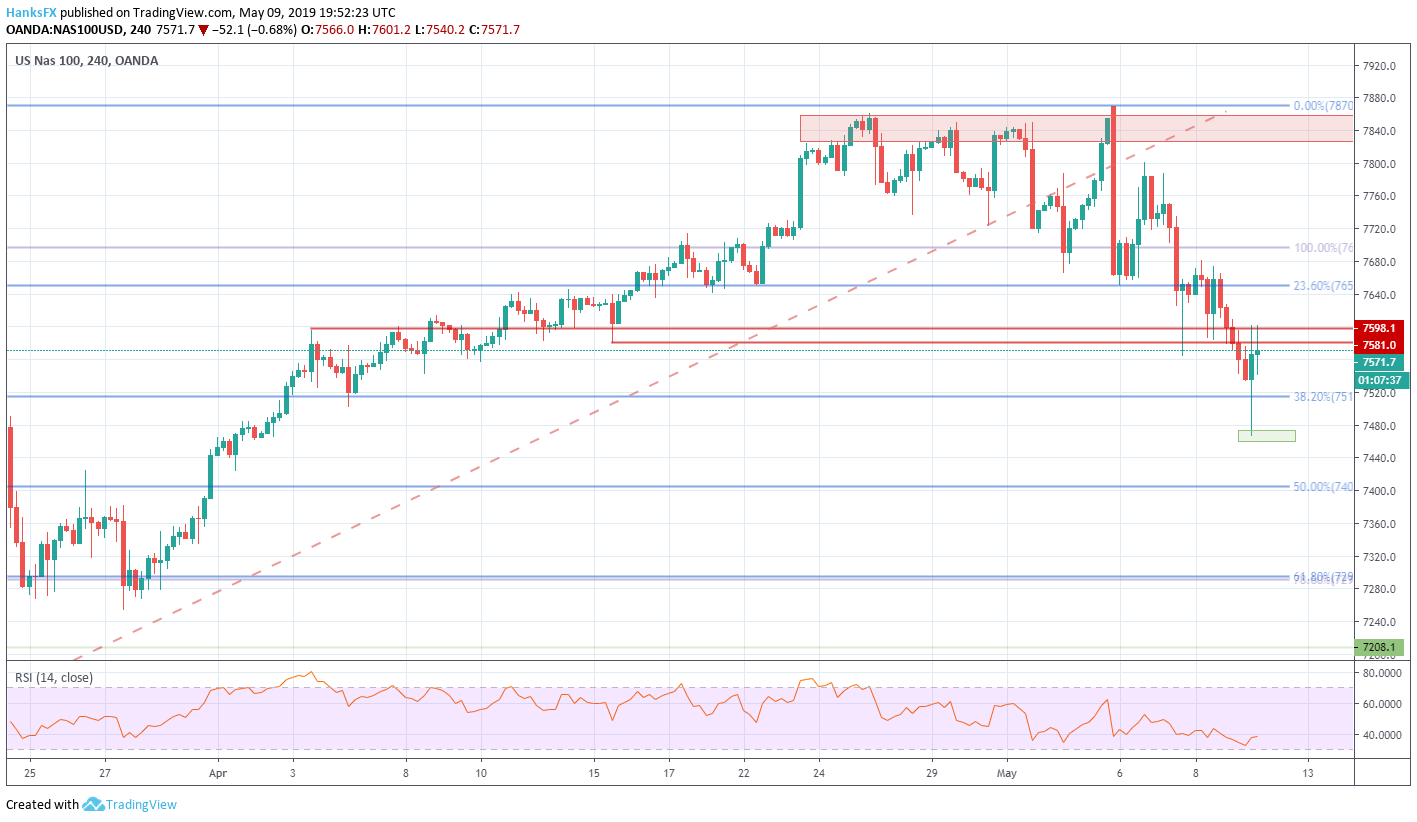
Finally, the tech-heavy Nasdaq finds itself between two Fib levels after bouncing from lows around 7,470. Those lows should now act as secondary support to the 38.20% retracement at 7,514. If the index is to attempt a move higher, it will first have to surmount minor horizontal resistance at 7,580 and 7,598. The two lines have influenced price action repeatedly in days prior and can be expected to do so again until evidence that they have been invalidated surfaces.
Nasdaq 100 Price Chart: 1 – Hour Time Frame (May 3 – May 9) (Chart 3)

Beyond horizontal resistance, the Nasdaq will have to contend with the 23.6% Fib level at 7,650 and prior highs from September and October 2018 around 7,696.
Nasdaq 100 Price Chart: 4 – Hour Time Frame (February 2019 – May 2019) (Chart 4)
An important factor to note across all three indices is how quickly they approached oversold territory. RSI is beneath 40 for each of them and Thursday’s lows will effectively be a line in the sand for Friday trading. Should the trade negotiations break down, look for those lows to be tested. A break beneath would plunge the indices into oversold territory. Check back to DailyFX.com for coverage and analysis of the trade talks. In the meantime, follow @PeterHanksFX on Twitter for real time updates and price action analysis.
--Written by Peter Hanks, Junior Analyst for DailyFX.com
Contact and follow Peter on Twitter @PeterHanksFX
Read more: Stock Market Volatility and its Relationship with S&P 500 Returns
DailyFX forecasts on a variety of currencies such as the US Dollar or the Euro are available from the DailyFX Trading Guides page. If you’re looking to improve your trading approach, check out Traits of Successful Traders. And if you’re looking for an introductory primer to the Forex market, check out our New to FX Guide.


