


Crude Oil Price Chart and Analysis:
- US-China trade war escalation dampens oil move higher.
- US sending a clear message to Iran.
The Brand New DailyFX Q2 2019 Trading Forecast and Guides are Available to Download Now!!
US President Donald Trump seems to be driving short- and medium-term oil price movement as US-China trade wars escalate along with heightened political tensions in Iran and Venezuela. And oil now sits just above a noted technical level which could add further volatility into the mix.
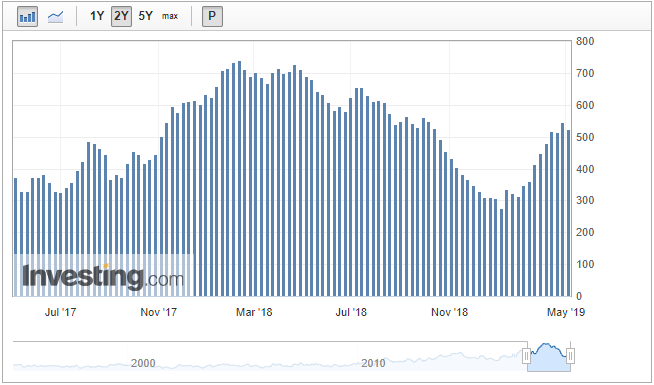
Crude oil speculative longs fell last week but still remain close to multi-month highs.
CFTC Crude Oil Speculative Net Positions
How to Trade Oil: Crude Oil Trading Strategies & Tips.
Oil’s recent sell-off on the back of increased trade tension between the US and China, with trade tariffs increased, sent oil spinning lower, only for the move to U-turn after political tensions between the US and Iran and Venezuela, ramped up. The US last night said that it had deployed an aircraft carrier force to the Middle East in response to indications of ‘a credible threat by Iranian regime forces’ towards US forces in the area. The US has also further tightened restrictions on Iran’s nuclear power program in an effort to stop the regime developing a nuclear weapon.
According to media reports, the US is said to be considering imposing further sanctions on Venezuela in an attempt to oust President Nicolas Maduro and replace him with opposition leader Juan Guaido. Further sanctions, and increased hostility in the country will continue to weigh on the country’s oil output.
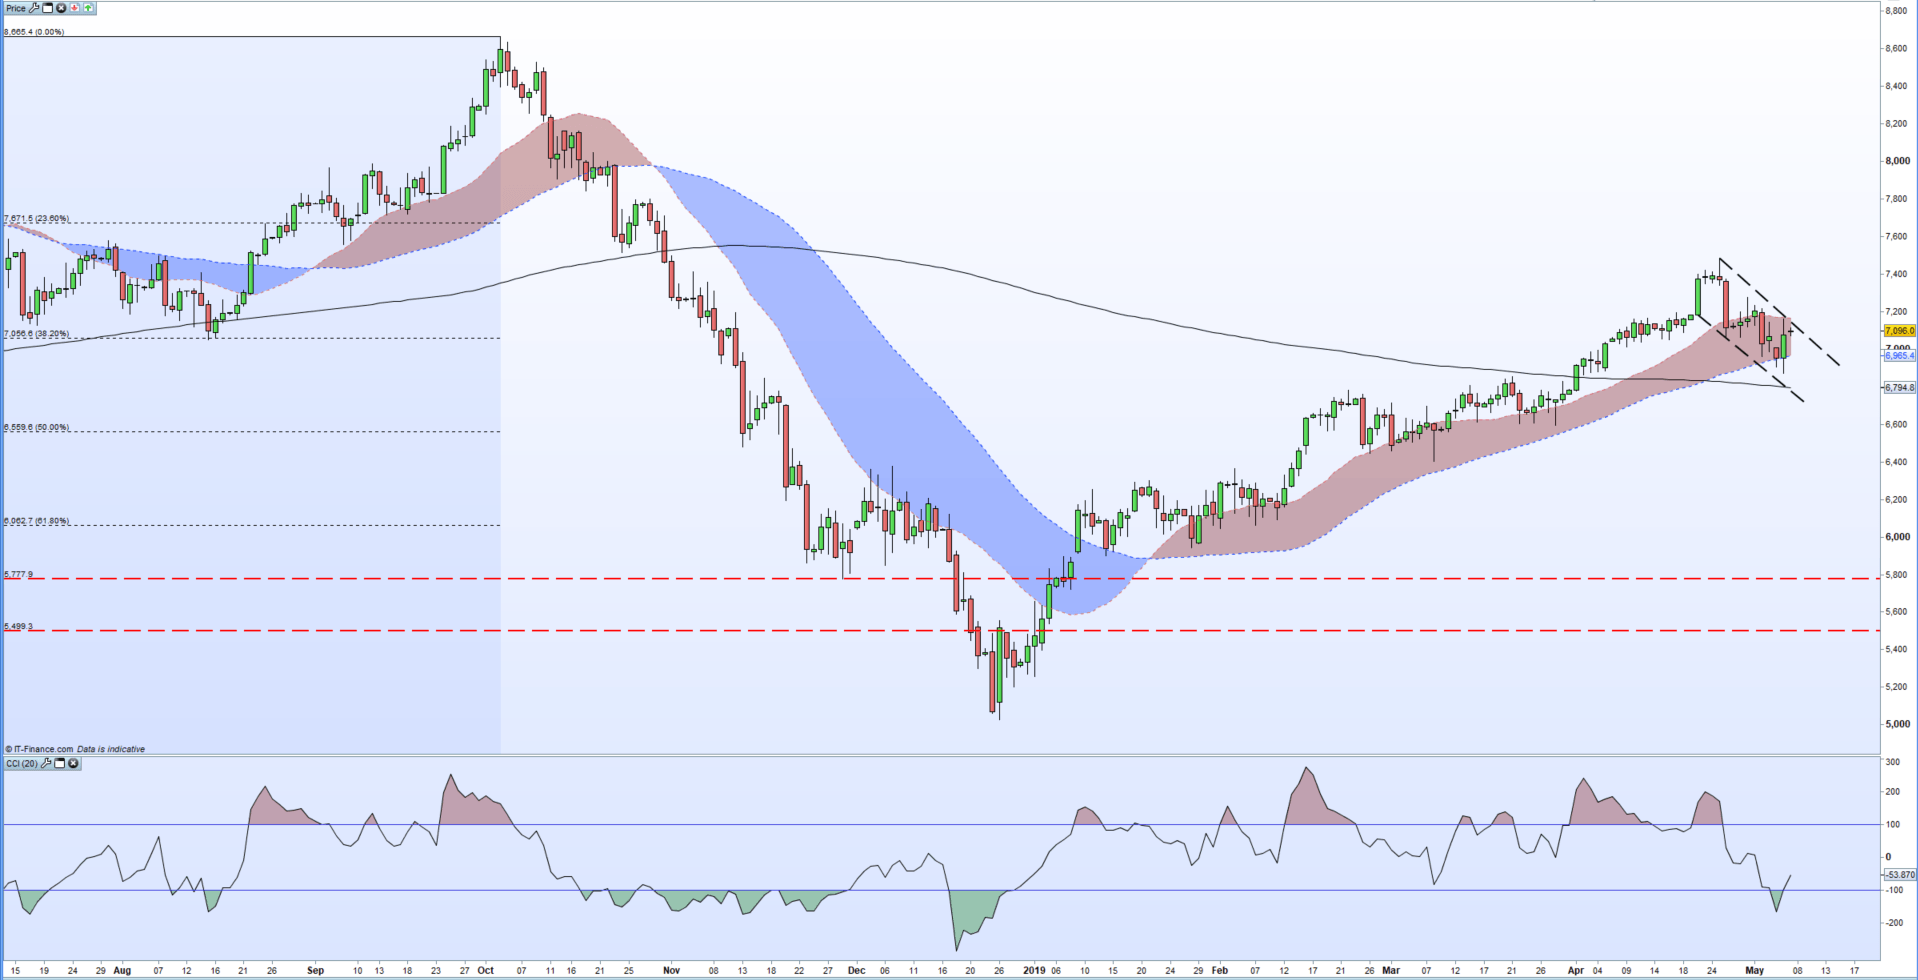
The daily crude oil chart shows the recent, whippy, price-action with an overall short-term downtrend off the April 26 multi-month high at $74.88/bbl. Crude oil hit a low of $68.65/bbl. yesterday before rebounding and the current spot price is now just above the 38.2% Fibonacci retracement level at $70.56/bbl., a level that has acted as both resistance and support over the last few weeks. If there is a break and close lower, then support should start at the 200-day moving average at $69.95/bbl. ahead of 50% Fibonacci retracement level at $65.59/bbl. Upside resistance should start around $71.66/bbl. yesterday’s high and the 20-day moving average.
Crude Oil Daily Price Chart (July 2018 – May 7, 2019)
Traders may be interested in two of our trading guides – Traits of Successful Traders and Top Trading Lessons – while technical analysts are likely to be interested in our latest Elliott Wave Guide.
What is your view on crude oil – bullish or bearish?? You can let us know via the form at the end of this piece or you can contact the author at nicholas.cawley@ig.com or via Twitter @nickcawley1.


