


Gold (XAU) Price Analysis and Charts.
- Gold reverses lower after FOMC meeting and eyes fresh yearly low.
- USD firms as Federal Reserve remains in ‘wait-and-see’ mode.
DailyFX Q2 Forecasts and Top 2019 Trading Opportunities.
Gold (XAU) Weakens Further as Fed Stands Pat
A whippy post-FOMC session for gold after the Federal Reserve indicated that US rates would remain unchanged for the foreseeable future. A brief rally was quickly bought to an end and the precious metal ended negative on the day, nearing a fresh yearly low. The Fed indicated that US inflation remained below target but suggested that no immediate rate cutes were needed and that it would continue to monitor price pressures. Market expectations of a 2019 rate cut were pared back slightly, giving the greenback a small boost.
Friday’s US Labour Report (NFPs) should now be the next driver of gold’s price action. Wednesday’s ADP employment report beat expectations, +275k against predictions of +180k, and while the correlation between this report and NFPs is not strongly correlated, the strength of the US jobs market remains clear. Monthly earnings and wages data will also need to be closely parsed.
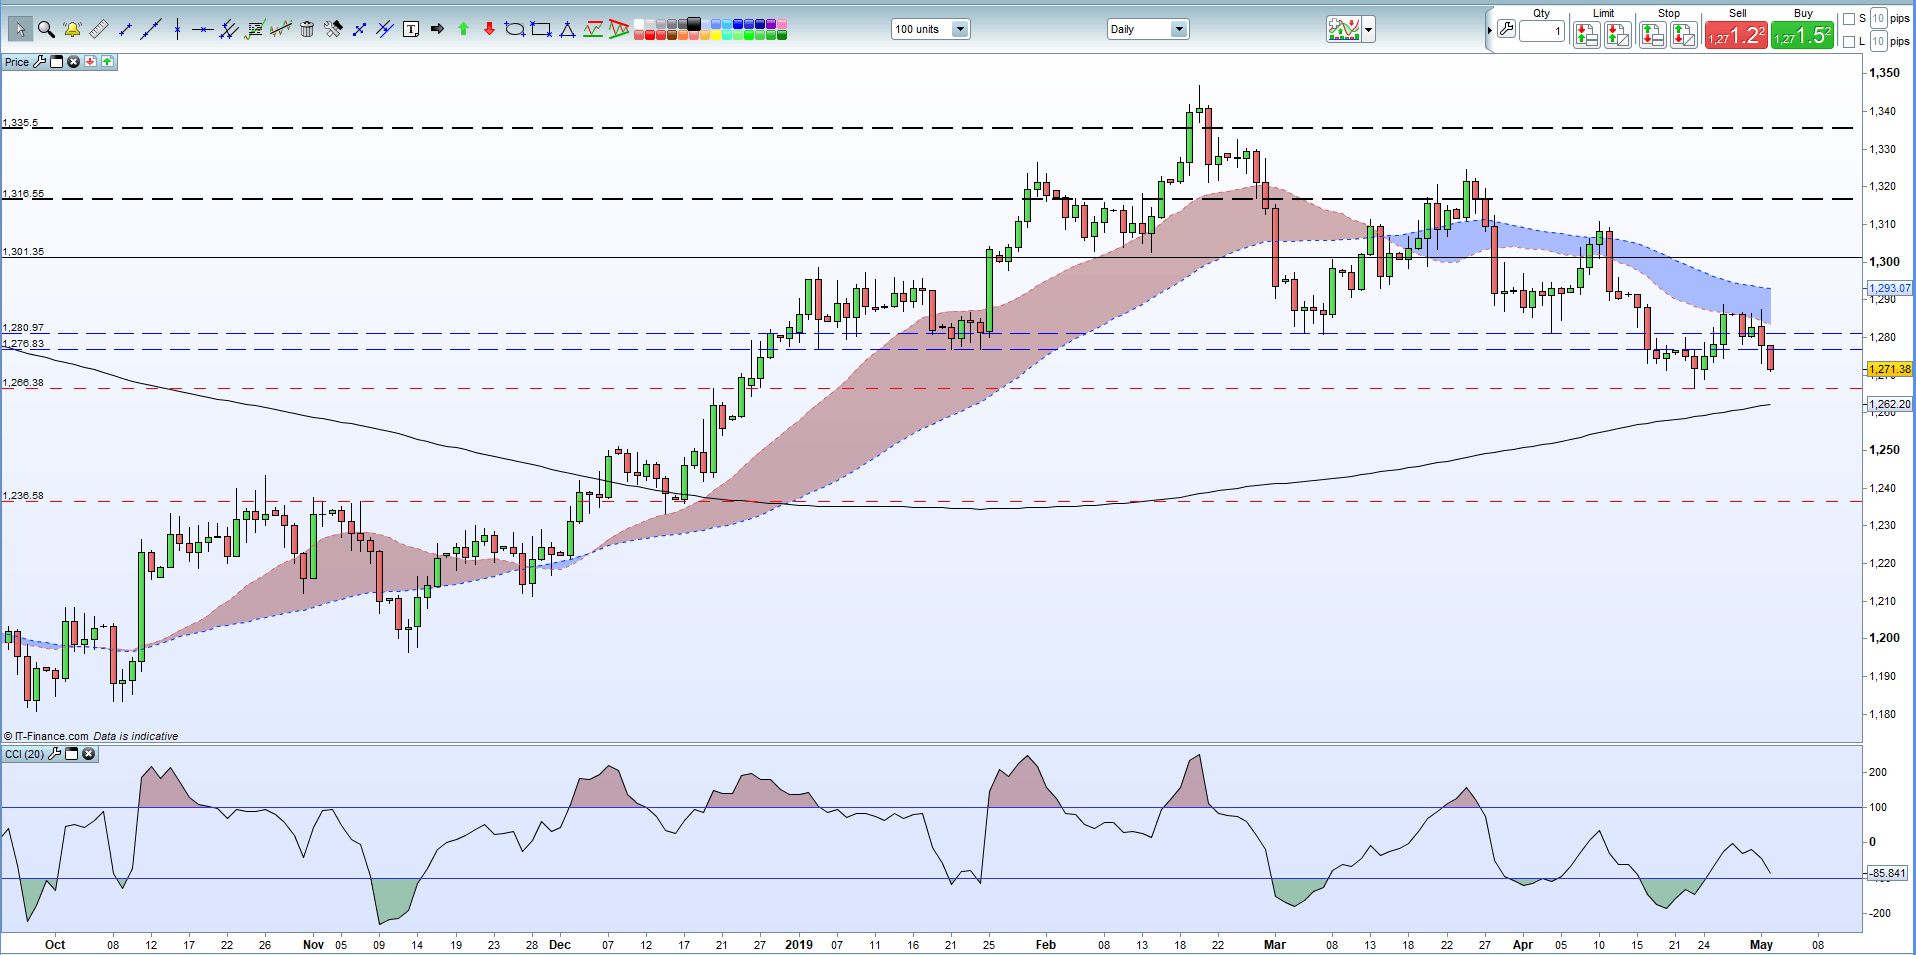
The daily gold chart is looking weak and the precious metal needs a bout of risk-aversion, or a weak NFP release, to help steady or reverse the recent sell-off. The pattern of lower highs and lower lows off the mid-February high continues and if gold breaks below the April 23 low at $1,266.4/oz then the next zone of technical support, the 200-day moving average and the 50% Fibonacci retracement, is at $1,262/oz. This cluster of support may prove key in the coming days. A bullish reversal is likely to find resistance around recent highs between $1,287/oz and $1,289/oz.
How to Trade Gold: Top Gold Trading Strategies and Tips
Gold (XAU) Daily Price Chart (September 2018 – May 2, 2019)
Trading the Gold-Silver Ratio: Strategies and Tips.
IG Client Sentiment data show that retail traders are 71.5% net-long gold, a bearish contrarian indicator. However, recent daily and weekly sentiment shifts suggest that the current gold trend may reverse higher.
--- Written by Nick Cawley, Market Analyst
To contact Nick, email him at nicholas.cawley@ig.com
Follow Nick on Twitter @nickcawley1


