


Crude Oil, Gold and Bitcoin (BTC) Price Analysis and Charts.
- Crude oil’s supportive uptrend remains in place as rally slows.
- Gold oversold but struggling to hold support.
- Bitcoin (BTC) forming a bullish pennant.
DailyFX Q2 Forecasts and Top 2019 Trading Opportunities.
Crude Oil –Rally Intact but Slowing Down
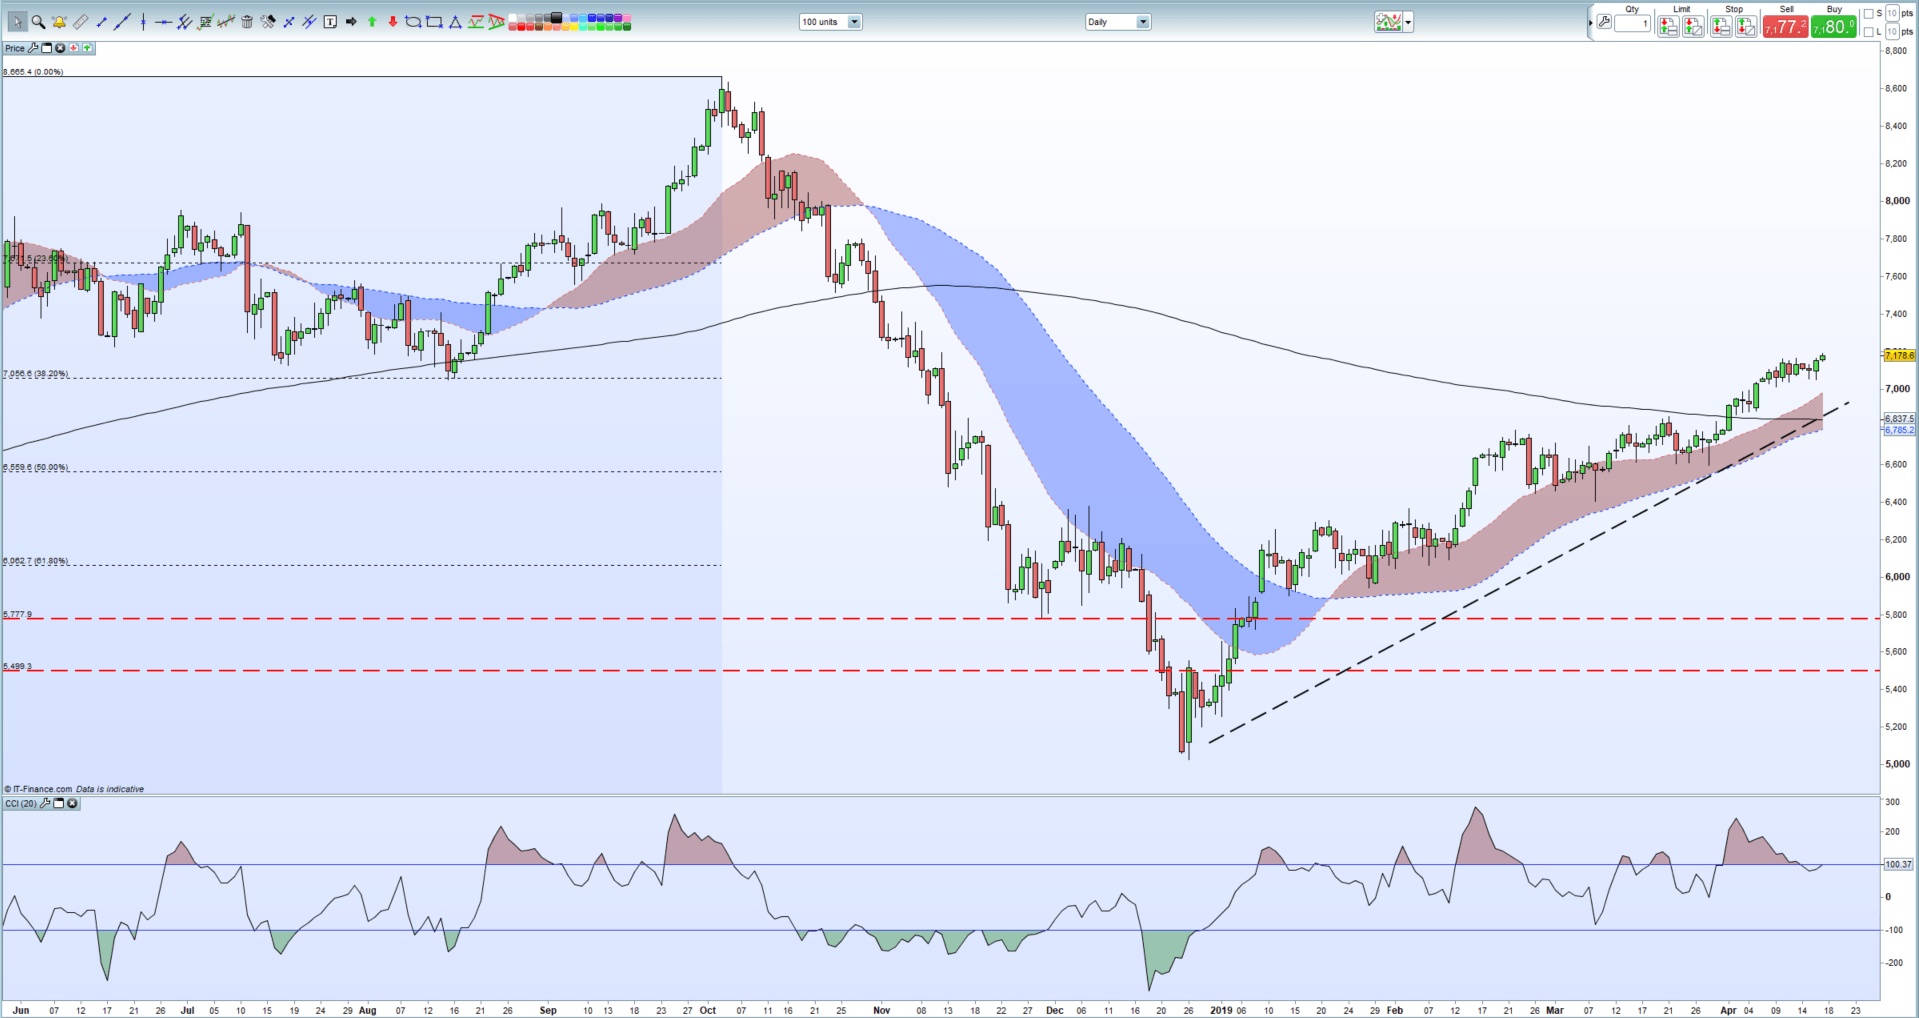
Crude oil’s 40%+ rally since December 26 last year is slowing down with price ranges narrowing and fresh highs becoming harder to print. The chart shows a positive backdrop with crude above all three moving averages and respecting this year’s bullish trendline. Crude produced a bullish signal earlier this month when the 20-day ma went above the 200-day ma and it looks likely the 50-day ma will do the same shortly producing a ‘golden cross’. Support currently starts at $70.56/bbl. off the 38.2% Fibonacci retracement of the June 2017 – October 2018 rally before the three moving averages come into play between $69.74/bbl. and $67.86/bbl. The longer-term upside target is $76.71/bbl. the 23.6% Fibonacci retracement.
How to Trade Oil: Crude Oil Trading Strategies and Tips.
Crude Oil Daily Price Chart (June 2018 – April 17, 2019)
Gold – Chart Bias Remains Negative in the Medium-Term
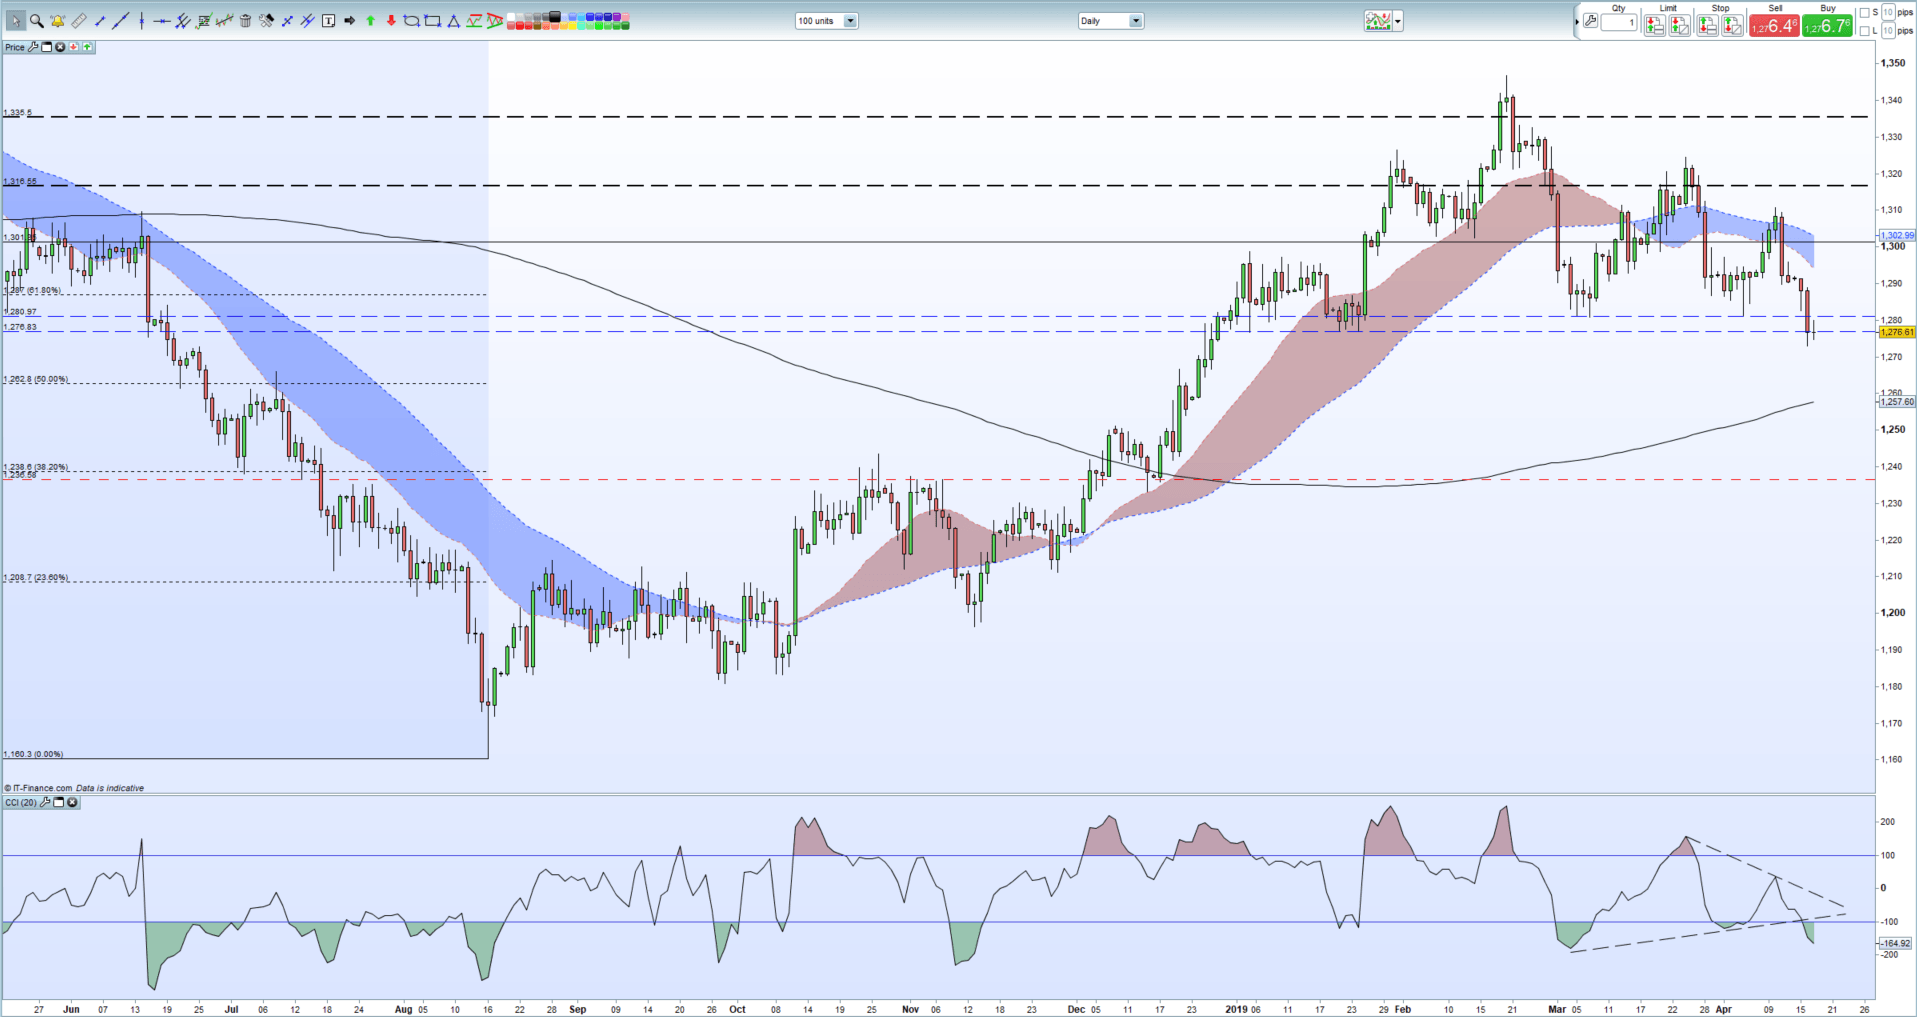
The $35/oz. sell-off in gold since last Thursday has pushed the precious metal through a notable support level provided by the 61.8% Fibonacci retracement at $1,287/oz. and back to the lowest level seen this year. The CCI indicator shows the recent move has pushed gold into oversold territory which may help stem losses, but the overall chart set-up continues to suggest lower prices ahead. The next area of support is seen between $1,262.8/oz. (50% Fib) and the 200-day moving average currently at $1,257.6/oz. Lower highs dominate off the February 20 high at $1,347/oz.
How to Trade Gold: Top Gold Trading Strategies and Tips.
Gold Daily Price Chart (May 2018 – April 17, 2019)
Bitcoin (BTC) – Flagging Higher Prices?
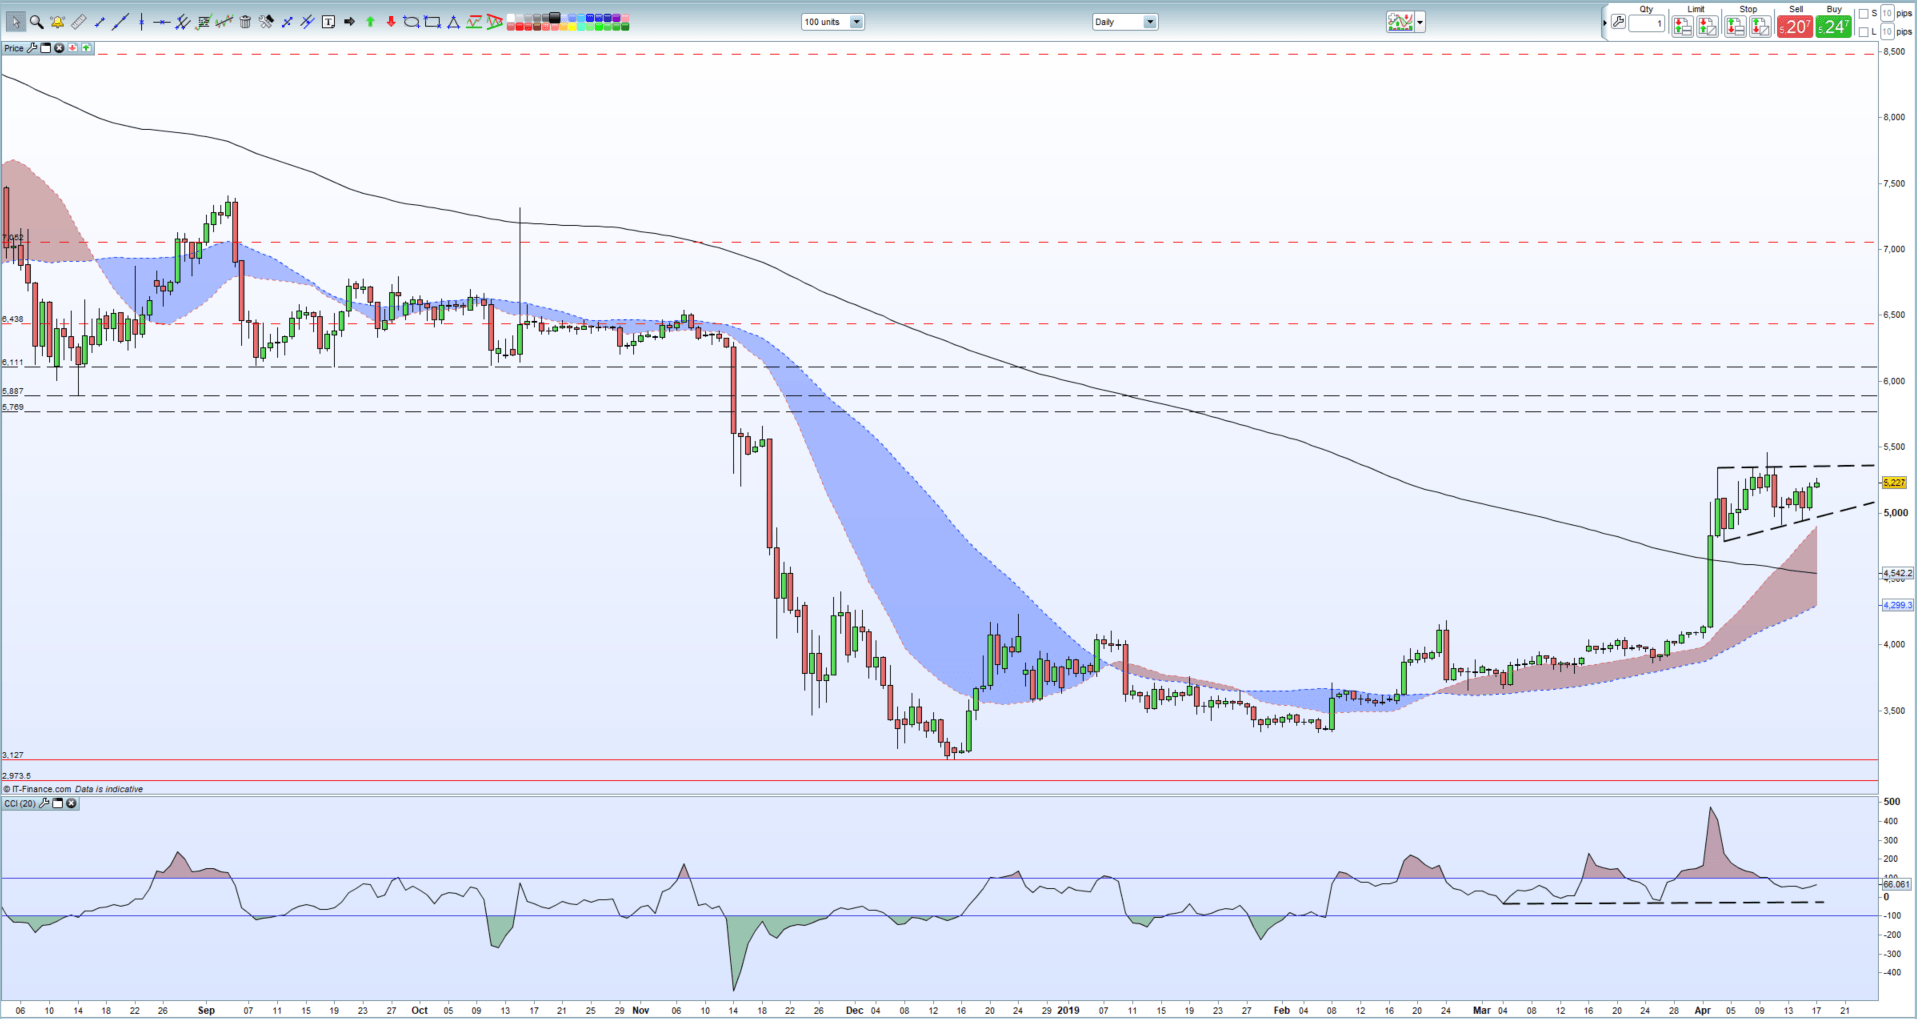
A bullish pennant is forming on the daily Bitcoin (BTC) chart which may suggest another break higher and back above $6,000. The April 2 pennant pole, if respected, would see a move around $900 higher taking Bitcoin up to the $6,111 level which is made up of three old supportive lows and the top of the gap made on the November 14 bear candle. The 20-day ma has broken above the 200-day ma while the CCI indicator is out of extreme oversold conditions. A clean break and close above $5,350 and, to a lesser extent, $5,460 is needed to target $5,769 before $6,111.
A Guide to Trading Bitcoin and Other Cryptocurrencies.
Bitcoin (BTC) Daily Price Chart (August 2018 – April 17, 2019)
IG Client Sentiment shows how retail traders are positioned in a wide range of currencies, commodities and cryptocurrencies. See how recent changes in positioning affect our trading bias.
--- Written by Nick Cawley, Market Analyst
To contact Nick, email him at nicholas.cawley@ig.com
Follow Nick on Twitter @nickcawley1


