


S&P 500 Outlook Talking Points:
- ISM services composite is expected at 58 for the month of March, down from 59.7 in February
- As roughly 80% of the US economy, services are a critical sector for growth and trade balances – a conclusion to the ongoing trade war could bolster the industry
- Learn to utilize IG Client Sentiment Data effectively with one of our many Live Sentiment Data Walkthroughs.
S&P 500 Outlook: Index Eyes Services Data, Trade War Progress
The S&P 500 will keep a watchful eye on the release of ISM services data on Wednesday. Thus far, the week has offered contrasting releases as retail sales fell short, but employment and manufacturing data came in above expectations. Subsequent price action suggests traders are content with the data and Wednesday’s release will give further insight on the economy’s growth outlook – which is showing signs of a rebound.
ISM Services Composite Index (Chart 1)
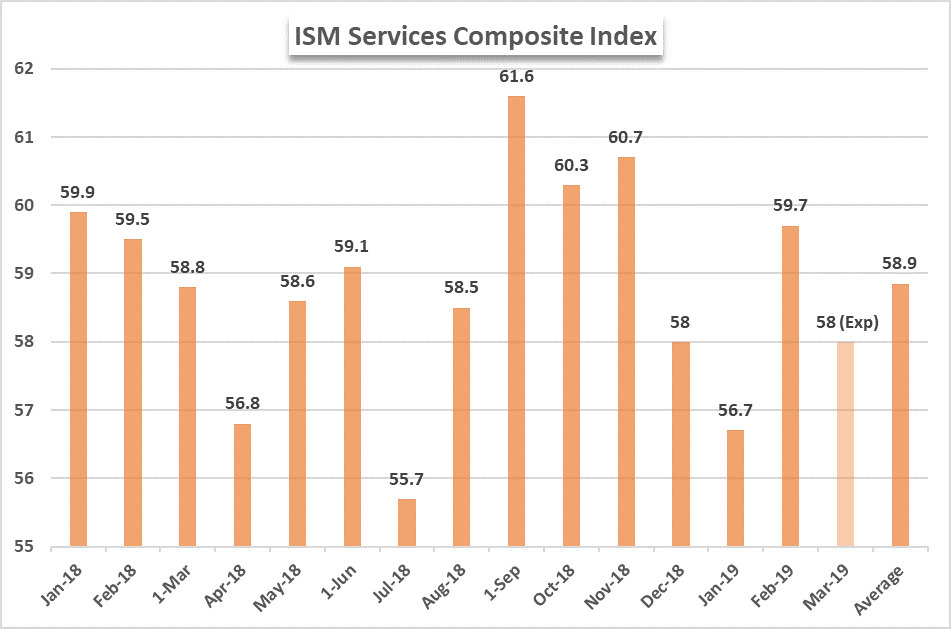
Source: ISM
Recent service sector data from the Institute of Supply Management has been relatively volatile over the last four months and notably lower than the composite readings from September to November. Apart from the expected data print tomorrow, the average of the composite index is 58.9 over the last 16 months. Should the data come in as expected, it could prove enough of a catalyst to push the S&P 500 higher given the current market sentiment and price trend. That said, it would contribute further – albeit slightly – to the broader concern of deteriorating economic growth.
Fresh quarterly forecasts are out! View Q2 forecasts for the S&P 500, US Dollar, British Pound and more.
Outside of hard data, trade war headlines may return to the fray. On Tuesday, an official from the US Commerce Department announced “US-China trade war talks are at a point where a deal is more likely to go forward than not.” The announcement precedes US-China trade negotiations in Washington this week, following discussions in Beijing at the end of last week. While trade war headlines have come and gone in the past, the theme has remained an underlying concern for US equities and frequently influenced sentiment.
S&P 500 Price Chart: Daily Time Frame (January 2018 – April 2019) (Chart 2)
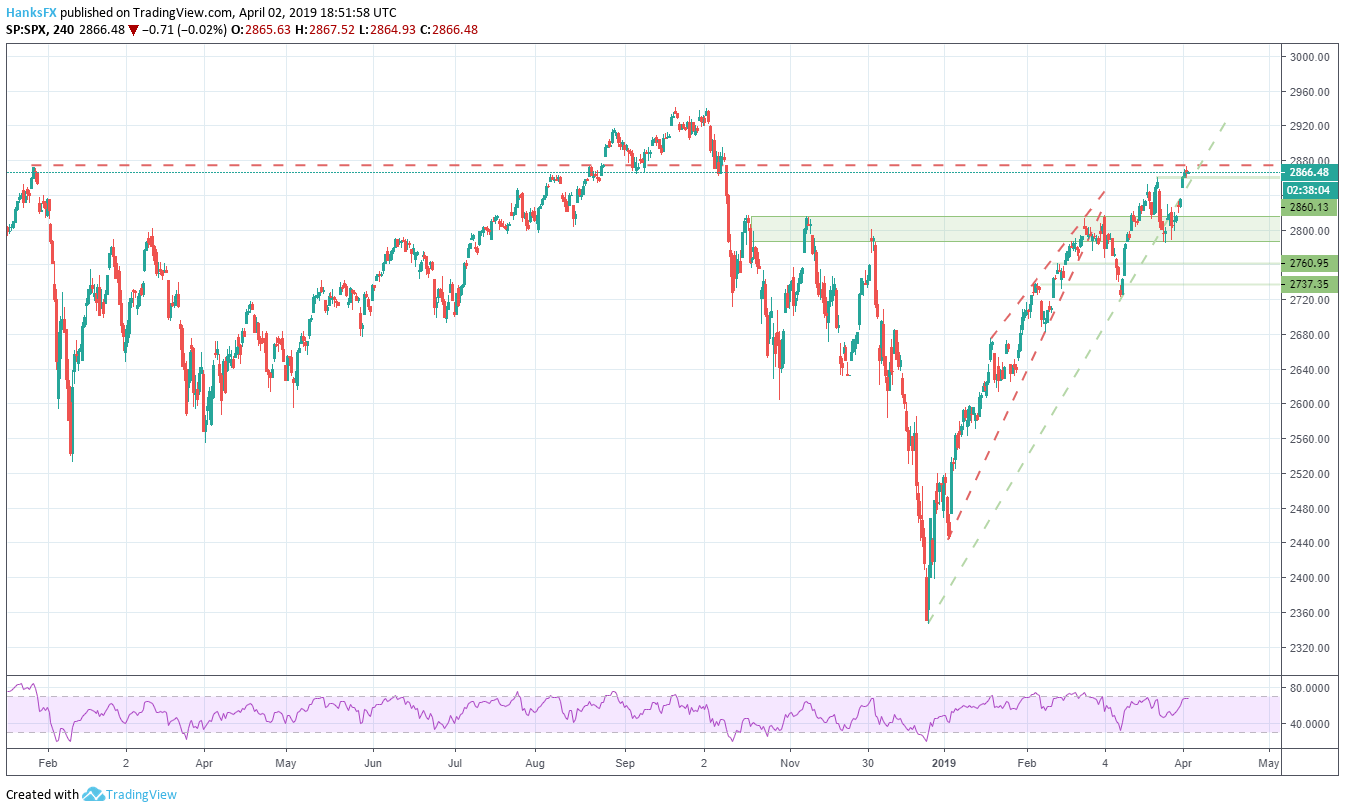
As for the immediate future, traders will have to decide whether short-term optimism and relatively robust data can outweigh longer-term concerns of slowing growth and trade wars as the S&P 500 runs into technical resistance at 2,875. The level marks the high from February 2018. If ISM data falls short, nearby support resides at 2,860.
A trendline from December 24 also exists to the downside, but the respect it commands as a technical level is questionable due to recent breaks and its steepness. For further equity insight, follow Peter Hanks on Twitter @PeterHanksFX.
--Written by Peter Hanks, Junior Analyst for DailyFX.com
Contact and follow Peter on Twitter @PeterHanksFX
Read more: S&P 500: Traders Remain Net-Short
DailyFX forecasts on a variety of currencies such as the US Dollar or the Euro are available from the DailyFX Trading Guides page. If you’re looking to improve your trading approach, check out Traits of Successful Traders. And if you’re looking for an introductory primer to the Forex market, check out our New to FX Guide.


