Gold Price Analysis, News and Pivot Points.
- Gold remains weak and sits on 61.8% Fibonacci retracement.
- US Treasury yields pick-up boosting the US dollar.
DailyFX Gold Landing Page – Prices, Charts, Analysis and Real-Time News
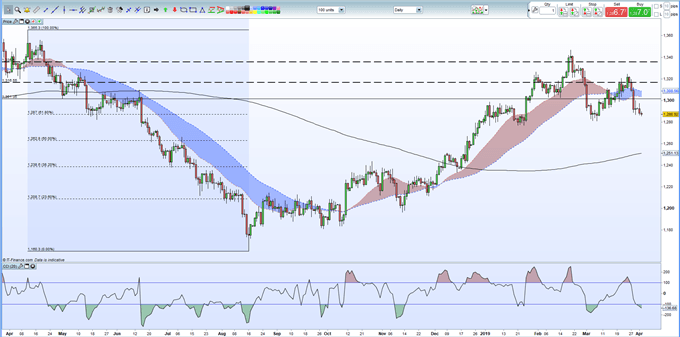
Gold continues to remain at multi-day lows and is straddling a strong technical level that needs to hold if the precious metal is to re-coup any of its recent losses. The precious metal is currently trading around $1,286.5/oz. just a tick below the 61.8% Fibonacci retracement level at $1,287/oz. of the April – August 2018 sell-off. There are also various horizontal support levels between $1,276/oz. and $1,285/oz. which may slow down any further sell-off. Below here the 50% Fibonacci retracement at $1,262.8/oz. and the 200-day moving average currently at $1,251/oz.
The chart is looking oversold in the short-term with the CCI indicator around -138 which may provide some support in the next few days. To the upside, $1,300/oz. ahead of $1,302/0z and $1,308/oz. the 20- and 50-day moving averages.
There are various US economic releases over the next few days which will steer the US dollar, and with-it gold, finishing with the latest US Labour Report (NFP) on Friday. US Treasury yields have started to pick-up this week, after slumping to, or near, multi-month lows last week and Friday’s jobs and wages report will be watched closely to see if the jobs growth can continue.
US Dollar Weekly Technical Outlook; USD Starting to Look Exhausted.
How to Trade Gold: Top Gold Trading Strategies and Tips.
Gold Chart Daily Time Frame (April 2018 – April 2, 2019)


IG Client Sentiment shows that retail traders are heavily net-long of Gold, a bearish contrarian indicator.
--- Written by Nick Cawley, Market Analyst
To contact Nick, email him at nicholas.cawley@ig.com
Follow Nick on Twitter @nickcawley1


