


Asia Pacific Markets Wrap Talking Points
- Asia stocks cautious as Brexit-induced optimism weakened
- S&P 500 futures hint deterioration in market mood ahead
- FTSE 100 may be getting ready to top via technical cues
Find out what retail traders’ equities buy and sell decisions say about the coming price trend!
Asia Pacific equities traded mixed on Thursday, failing to uniformly find follow-through from the prior upbeat Wall Street session. A lot of the optimism from the UK’s Parliament rejecting a ‘no-deal’ Brexit quickly faded as the Nikkei 225 traded lower after gapping to the upside. Yet, the Japanese benchmark stock index had not fully closed the gap at the time of this writing, but was seemingly on the way to do so.
This is understandable, while odds of a hard Brexit might have been trimmed, there remain numerous uncertainties for the road ahead between the UK and the EU. UK Prime Minister Theresa May’s revised deal may even get a third round of voting on March 20th. South Korea’s KOSPI was close to little changed at -0.11% while Australia’s ASX 200 rose about 0.2%.
Some of the worst-performing equities were in China where the Shanghai Composite which declined over one percent. In addition to the fallback in market mood, soft local industrial production data might have played a role in this. S&P 500 futures are now pointing lower, hinting that the cautious mood in the markets may echo into the remaining 24 hours.
GBP/USD trimmed most of the gains acquired on the latest Brexit votes in UK’s Parliament, as anticipated. Its pullback was accompanied with gains in the US Dollar as the pro-risk Australian and New Zealand Dollars fell. Interestingly, the anti-risk Japanese Yen weakened while the similarly-behaving Swiss Franc outperformed. This may have been due to the latter acting as a regional haven for EU geopolitical concerns.
FTSE 100 Technical Analysis
The FTSE 100 continues to trade within a well-defined range with lower-boundary support at 7041 while respective resistance is around 7267. Within this consolidation, a head and shoulders bearish reversal pattern seems to have formed (see chart below). Clearing neckline support and the rising trend line from the end of last year would be a step towards confirming this candlestick pattern.
FTSE 100 Daily Chart
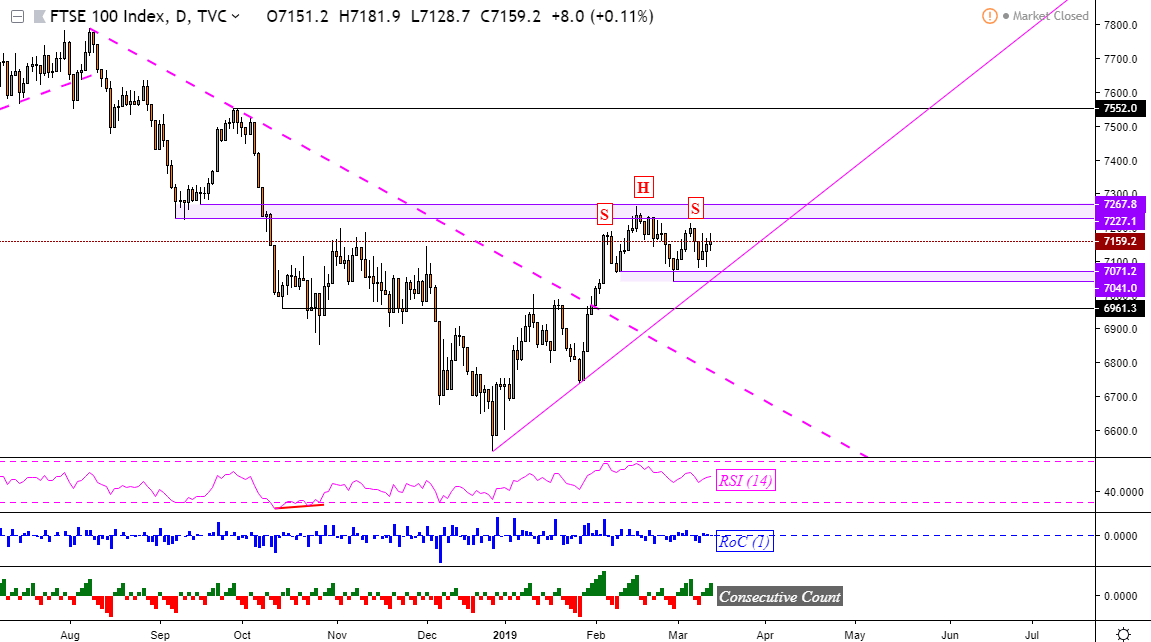
Chart Created in TradingView
FX Trading Resources
- See how equities are viewed by the trading community at the DailyFX Sentiment Page
- Just getting started? See our beginners’ guide for FX traders
- Having trouble with your strategy? Here’s the #1 mistake that traders make
--- Written by Daniel Dubrovsky, Junior Currency Analyst for DailyFX.com
To contact Daniel, use the comments section below or @ddubrovskyFX on Twitter


