


Stock Market Talking Points:
- Aircraft, automotive, manufacturing, semiconductor and agricultural sectors have lagged the S&P 500 in recent months
- Despite trade optimism between the US and China, the sectors have been pressured as China’s growth is set to slow
- A trade war breakthrough could spark a rebound in companies sensitive to Chinese demand
See how IG clients are positioned on the Dow Jones, Crude oil and the US Dollar with our free IG Client Sentiment Data.
Export-heavy sectors in the Dow Jones may remain pressured in the coming days as markets come to terms with lower Chinese GDP forecasts. On Tuesday, Chinese Premier Li Keqiang said the Chinese government will aim for the economy to grow in a range of 6% to 6.5% in 2019, compared to last year’s 6.5% goal. Despite progress toward a US-China trade war deal and significant optimism regarding the talks in markets, materially lower GDP will likely constitute a reevaluation of earnings to be garnered in sectors that rely on Chinese exports.
Read up on A Brief History of Trade Wars for a primer on economic conflicts of the past.
The sectors which export the most to China: aircraft, machinery, agriculture, automotive and microchips account for roughly $67 billion in annual exports according to the Office of the United States Trade Representative. Together, the export totals from the five sectors make up approximately 51% of the $129.9 billion in total US exports to China. To gauge the impact of lowered GDP forecasts on US equities, the aggregated ETF prices of the largest fund from each sector can be compared to the S&P 500.
Dow Jones Price Chart: Daily Time Frame (January 2018 – March 2019) (Chart 1)
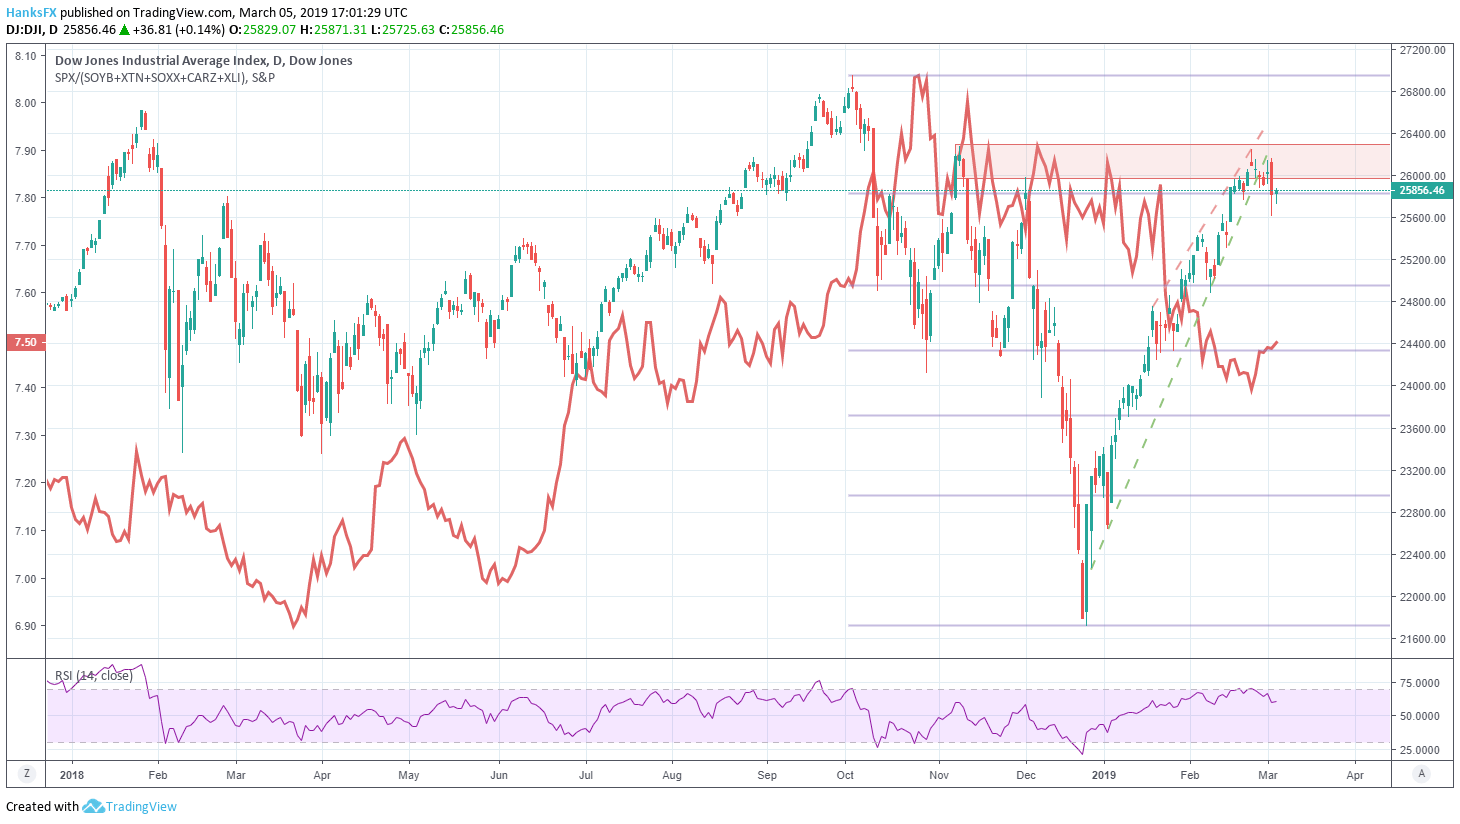
Dow Jones Price Chart overlaid with ratio of S&P 500 to SOYB, XLI, XTN, SOXX, CARZ ETFs
While the index is imperfect in capturing all export components, it does serve to provide a general overview of the performance of companies sensitive to Chinese growth and imports. Major names in the underlying funds include Boeing, Ford, Caterpillar, Micron and General Motors. Therefore, their impact on the broader indices of the Dow Jones and the S&P 500 can be substantial.
Looking to take your trading to the next level? Check out our free Advanced Trading Guides.
Moving forward, the underlying shares and sectors may be a source of volatility in the US equity market as traders and investors iron out the revenue implications of slower Chinese growth. Conversely, a trade-war breakthrough could serve to buoy the threatened sectors.
A deal could also propel the agricultural sector, most notably soybeans (SOYB ETF), to rebound to pre-trade war levels. Such a rebound would likely make meaningful progress in driving the ratio of the funds lower versus the S&P 500, recapturing some of the lost ground over the last nine months and offering an opportunity for the sector to outperform benchmarks.
--Written by Peter Hanks, Junior Analyst for DailyFX.com
Contact and follow Peter on Twitter @PeterHanksFX
Read more: Stock Market Fund Inflows Return as S&P 500 Hits Technical Resistance
DailyFX forecasts on a variety of currencies such as the US Dollar or the Euro are available from the DailyFX Trading Guides page. If you’re looking to improve your trading approach, check out Traits of Successful Traders. And if you’re looking for an introductory primer to the Forex market, check out our New to FX Guide.


